Volume 19, Number 10—October 2013
Dispatch
Evolution of Influenza A Virus H7 and N9 Subtypes, Eastern Asia
Figure 1
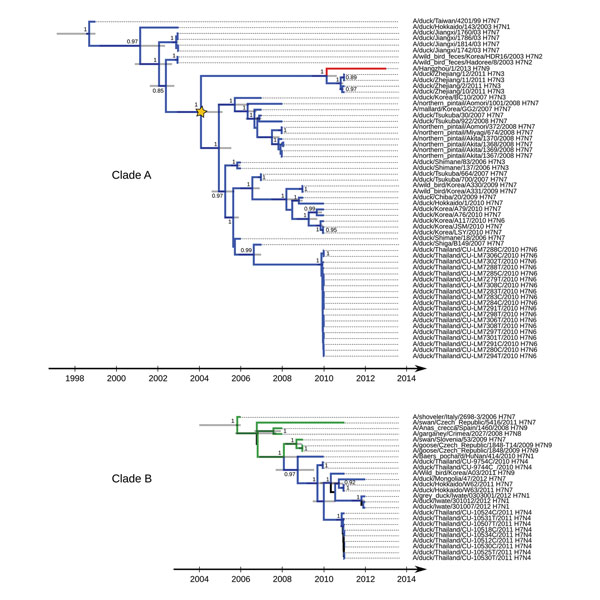
Figure 1. . Maximum clade credibility trees for co-circulating influenza A virus H7 subtype genetic lineages, eastern Asia. A) Clade A. B) Clade B. Values along the branches are posterior probability values >0.8. Gray bars indicate 95% highest posterior density for times of the most recent common ancestors; blue indicates viruses isolated in Asia; green indicates viruses isolated in Europe (details on locations and associated posterior probabilities are shown in the online Technical Appendix, wwwnc.cdc.gov/EID/article/19/10/13-0609-Techapp1.pdf); red indicates A/Hangzhou/1/2013(H7N9) virus; and yellow star indicates most recent common ancestral influenza virus among A/Hangzhou/1/2013(H7N9) virus, Zhejiang domestic ducks viruses (H7N3), and influenza A virus H7 subtype circulating in wild birds.