Volume 19, Number 11—November 2013
Dispatch
Incidence of Influenza A(H1N1)pdm09 Infection, United Kingdom, 2009–2011
Figure 1

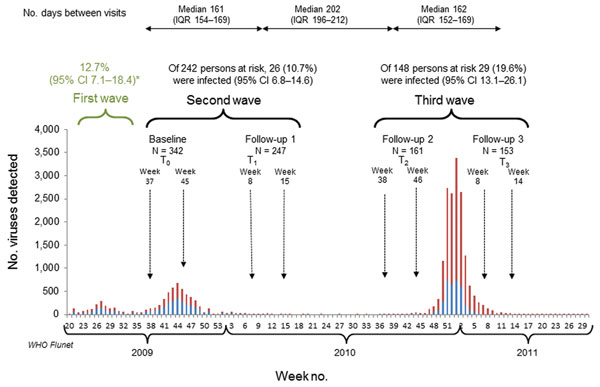
Figure 1. . Incidence of natural influenza A(H1N1)pdm09 infection in the study cohort during the 3 pandemic waves in context of the evolving pandemic, United Kingdom. Study outline is depicted in the upper panel in temporal context of the pandemic during the 2009–2011 influenza seasons. The bar chart shows UK influenza virologic surveillance data from WHO Flunet (www.who.int/influenza/gisrs_laboratory/flunet/en/) highlighting the periods of study recruitment and follow-up in relation to influenza A activity in the United Kingdom during 2009–2011. Red bars indicate influenza A of all subtypes; blue bars indicate the number of A(H1N1)pdm09 cases detected by virologic national surveillance. Healthy adults were recruited after the first pandemic wave (April–August 2009) had ended in the United Kingdom and were followed over 2 influenza seasons, with serum samples collected before and at the end of each influenza season. The median time between visits is shown. The second wave was defined as baseline (September–November 2009) to first follow-up (February–April 2010) and the third wave as the time between the second follow-up (August–November 2010) and the third follow-up (February–April 2011). The green bracket and numerals represent the estimated cumulative incidence of infection over the first pandemic wave by calculating the difference between and seroprevalence rates at baseline in the cohort and prepandemic (2008) published seroprevalence rates. Infection was defined as detection of A(H1N1)pdm09 virus in nasal swabs returned during the second or third wave or a 4-fold rise in A(H1N1)pdm09 virus HI titer in paired serum samples collected at the start and end of each wave. The number of infected persons with total persons at risk during each of the second and third waves with calculated incidence rate and 95% CIs are shown. WHO, World Health Organization; IQR, interquartile range; HI, hemagglutination-inhibition. *Infection rates in the first wave reflect cumulative incidence of infection, estimated by calculating the difference in proportion of persons with HI titer >32 between baseline (T0) and published Health Protection Agency data before the pandemic in 2008.