Skip directly to site content Skip directly to page options Skip directly to A-Z link Skip directly to A-Z link Skip directly to A-Z link
Volume 19, Number 3—March 2013
Research

Treatment Outcomes for Extensively Drug-Resistant Tuberculosis and HIV Co-infection

Max R. O’DonnellComments to Author , Nesri Padayatchi, Charlotte Kvasnovsky, Lise Werner, Iqbal Master, and C. Robert Horsburgh
Author affiliations: Author affiliations: Albert Einstein College of Medicine, Bronx, New York, USA (M.R. O’Donnell); Centre for AIDS Programme of Research in South Africa, Durban, South Africa (M.R. O’Donnell, N. Padayatchi, L. Werner); University of Maryland School of Medicine, Baltimore, Maryland, USA (C. Kvasnovsky); King George V Hospital, Sydenham, South Africa (I. Master); Boston University School of Public Health, Boston, Massachusetts, USA (C.R. Horsburgh, Jr.); Boston University School of Medicine, Boston (C.R. Horsburgh, Jr.)

Main Article

Figure 2

A) Kaplan-Meier curves for sputum culture conversion for HIV-positive (dashed line) and HIV-negative (solid line) patients with extensively drug-resistant tuberculosis (XDR TB) receiving treatment, KwaZulu-Natal Province, South Africa. Sputum culture conversion is defined as 2 consecutive monthly TB cultures with no growth after 6 weeks of incubation after initiation of treatment (p = 0.706). p value was adjusted for age, initial smear result, and HIV status. B) Kaplan-Meier curves for patients

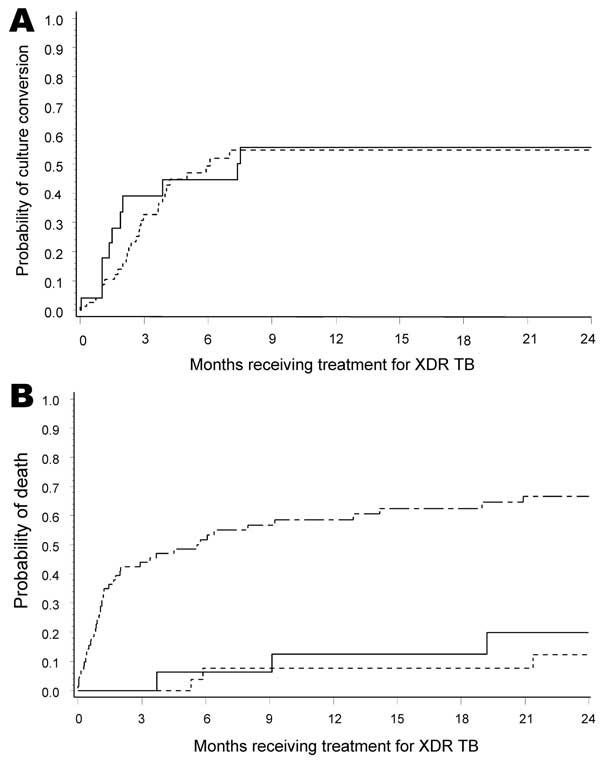
Figure 2. . A) Kaplan-Meier curves for sputum culture conversion for HIV-positive (dashed line) and HIV-negative (solid line) patients with extensively drug-resistant tuberculosis (XDR TB) receiving treatment, KwaZulu-Natal Province, South Africa. Sputum culture conversion is defined as 2 consecutive monthly TB cultures with no growth after 6 weeks of incubation after initiation of treatment (p = 0.706). p value was adjusted for age, initial smear result, and HIV status. B) Kaplan-Meier curves for patients receiving treatment for XDR TB stratified by sputum culture conversion status (p<0.0001). Solid line indicates conversion ≤2 months after initiation of treatment, dashed line indicates conversion >2 months after initiation of treatment, and top line with small and large dashes indicates no conversion. p values were adjusted for sex, TB treatment history, and HIV status. There was no significant difference between patients who showed culture conversion <2 months and >2 months after initiation of treatment (p = 0.5182).

Main Article

Page created: March 21, 2013
Page updated: March 21, 2013
Page reviewed: March 21, 2013
The conclusions, findings, and opinions expressed by authors contributing to this journal do not necessarily reflect the official position of the U.S. Department of Health and Human Services, the Public Health Service, the Centers for Disease Control and Prevention, or the authors' affiliated institutions. Use of trade names is for identification only and does not imply endorsement by any of the groups named above.
file_external