Volume 19, Number 4—April 2013
Research
Predicting Hotspots for Influenza Virus Reassortment
Trevon L. Fuller , Marius Gilbert, Vincent Martin, Julien Cappelle, Parviez Hosseini, Kevin Y. Njabo, Soad Abdel Aziz, Xiangming Xiao, Peter Daszak, and Thomas B. Smith
Figure 2
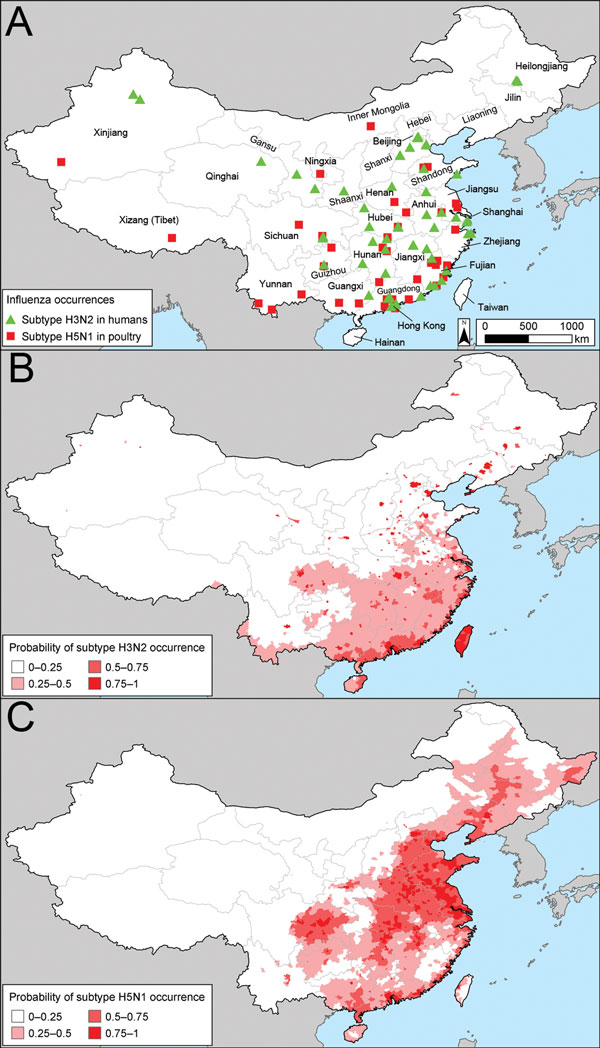
Figure 2. . . Influenza empirical data and occurrence maps for influenza virus subtypes H3N2 and H5N1. A) Observed cases of subtypes H3N2 and H5N1 in People’s Republic of China, according to outbreaks reported to the Chinese Ministry of Agriculture. B) Spatial model of the probability of subtype H3N2 at the prefecture scale predicted by using logistic regression. C) Risk for subtype H5N1 according to the outbreak dataset. See , for the corresponding map for the surveillance dataset.
Page created: March 13, 2013
Page updated: March 13, 2013
Page reviewed: March 13, 2013
The conclusions, findings, and opinions expressed by authors contributing to this journal do not necessarily reflect the official position of the U.S. Department of Health and Human Services, the Public Health Service, the Centers for Disease Control and Prevention, or the authors' affiliated institutions. Use of trade names is for identification only and does not imply endorsement by any of the groups named above.