Volume 19, Number 5—May 2013
Research
Full-Genome Deep Sequencing and Phylogenetic Analysis of Novel Human Betacoronavirus
Matthew Cotten, Tommy T. Lam, Simon J. Watson, Anne L. Palser, Velislava Petrova, Paul Grant, Oliver G. Pybus, Andrew Rambaut, Yi Guan, Deenan Pillay, Paul Kellam , and Eleni Nastouli
Figure 1
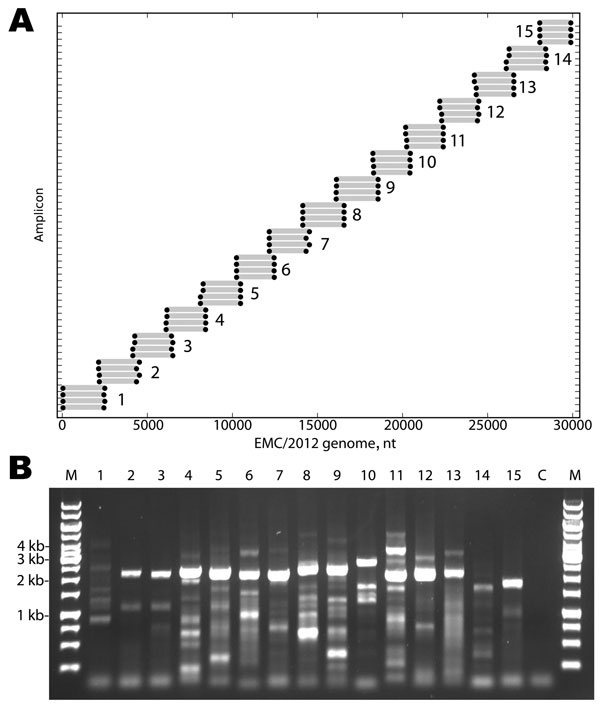
Figure 1. . . . A) Primers designed for reverse transcription and overlapping PCR amplification of the novel coronavirus (CoV). Dots indicate the predicted binding site of each primer along the EMC/2012 genome (x-axis). Gray bars indicate predicted amplicon lengths. Amplicon numbers are indicated beside each set of products. B) PCR products (3 µL of a 25-µL reaction) were resolved by electrophoresis on a 0.6% agarose gel and visualized by ethidium bromide staining. Lane M is the molecular weight marker (sizes indicated at left), Lanes 1–15 show the products of the amplicons depicted in Panel A. Lane C is the reagent PCR control.
Page created: April 23, 2013
Page updated: April 23, 2013
Page reviewed: April 23, 2013
The conclusions, findings, and opinions expressed by authors contributing to this journal do not necessarily reflect the official position of the U.S. Department of Health and Human Services, the Public Health Service, the Centers for Disease Control and Prevention, or the authors' affiliated institutions. Use of trade names is for identification only and does not imply endorsement by any of the groups named above.