Volume 19, Number 8—August 2013
Research
Outbreak-associated Salmonella enterica Serotypes and Food Commodities, United States, 1998–2008
Brendan R. Jackson , Patricia M. Griffin, Dana Cole, Kelly A. Walsh, and Shua J. Chai
Figure
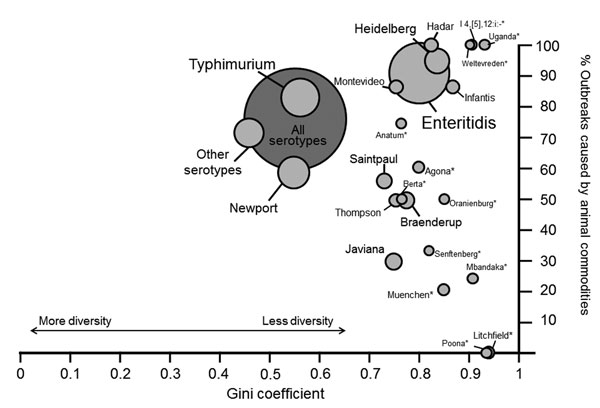
Figure. . . . Gini coefficient and percentage of outbreaks attributed to animal commodities for each Salmonella enterica serotype, Foodborne Disease Outbreak Surveillance System, United States, 1998–2008. Size of circle indicates number of outbreaks for each serotype. Animal commodities include land animals (beef, chicken, eggs, game, pork, and turkey) and aquatic animals (crustaceans, fish, and mollusks). *Serotypes with <5 outbreaks. The Gini coefficient is a measure of diversity; a value of 0 indicates an equal distribution of outbreaks caused by a serotype across all commodities, and a value of 1 indicates that all outbreaks were attributed to a single commodity.
Page created: July 19, 2013
Page updated: July 19, 2013
Page reviewed: July 19, 2013
The conclusions, findings, and opinions expressed by authors contributing to this journal do not necessarily reflect the official position of the U.S. Department of Health and Human Services, the Public Health Service, the Centers for Disease Control and Prevention, or the authors' affiliated institutions. Use of trade names is for identification only and does not imply endorsement by any of the groups named above.