Volume 20, Number 1—January 2014
Research
Genomic Epidemiology of Vibrio cholerae O1 Associated with Floods, Pakistan, 2010
Figure 1
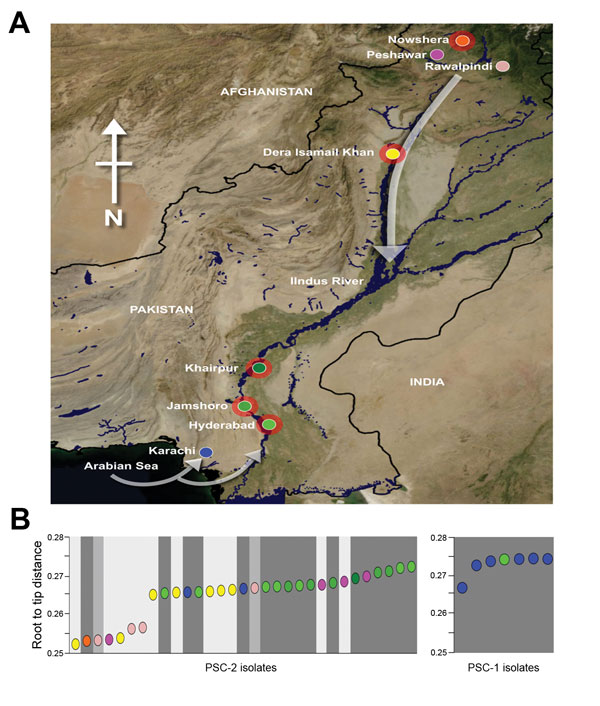
Figure 1. . Cholera during the floods, Pakistan, 2010. A) North-oriented map of Pakistan indicating the 8 locations of Vibrio cholerae O1 El Tor isolation (shown by individual circles; red outer shading indicates the 5 locations that had flooding during the study period). White arrows indicate the hypothesized directions of spread of the various subclades of V. cholerae O1 El Tor. B) Cumulative root-to-tip distances of subclade 2 and subclade 1 V. cholerae O1 El Tor isolates. Each colored circle corresponds with an individual V. cholerae O1 El Tor isolate; colors correspond with the locations shown in panel A. Shading corresponds with the month of V. cholerae O1 El Tor isolation: light gray, August; medium gray, September; dark gray, October.
1These authors contributed equally to this article.