Volume 20, Number 6—June 2014
Research
Human Polyomavirus 9 Infection in Kidney Transplant Patients
Els van der Meijden , Herman F. Wunderink, Caroline S. van der Blij-de Brouwer, Hans L. Zaaijer, Joris I. Rotmans, Jan Nico Bouwes Bavinck, and Mariet C.W. Feltkamp
Figure 2
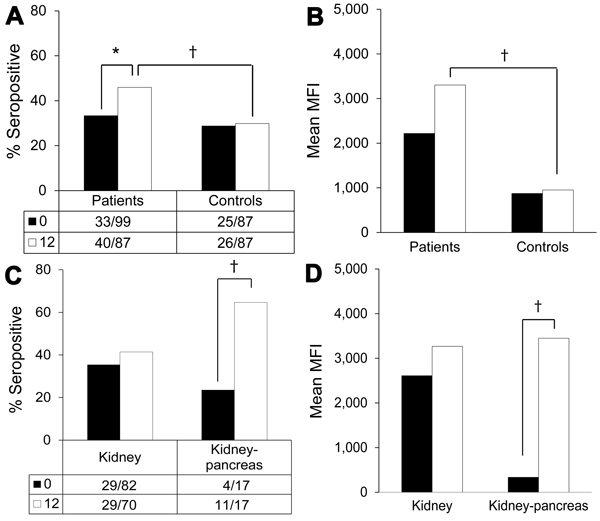
Figure 2. Human polyomavirus 9 (HPyV9) seropositivity and seroreactivity in samples from transplant patients and healthy blood donor controls collected 1 year apart, the NetherlandsBlack bars, baseline samples; white bars, follow-up samples (Table 2)Values below bars indicate nopersons positive/total notestedA) Seropositivity percentages for transplant patients and controls; B) seroreactivity levels for transplant patients and controls; C) seropositivity percentages for kidney transplant and kidney–pancreas transplant patients; D) seroreactivity levels for kidney transplant and kidney–pancreas transplant patientsMFI, median fluorescent intensity*Borderline significant (0.05<p<0.100); †significant (p<0.05).
Page created: March 28, 2014
Page updated: March 28, 2014
Page reviewed: March 28, 2014
The conclusions, findings, and opinions expressed by authors contributing to this journal do not necessarily reflect the official position of the U.S. Department of Health and Human Services, the Public Health Service, the Centers for Disease Control and Prevention, or the authors' affiliated institutions. Use of trade names is for identification only and does not imply endorsement by any of the groups named above.