Volume 20, Number 6—June 2014
Research
Human Polyomavirus 9 Infection in Kidney Transplant Patients
Els van der Meijden , Herman F. Wunderink, Caroline S. van der Blij-de Brouwer, Hans L. Zaaijer, Joris I. Rotmans, Jan Nico Bouwes Bavinck, and Mariet C.W. Feltkamp
Figure 3
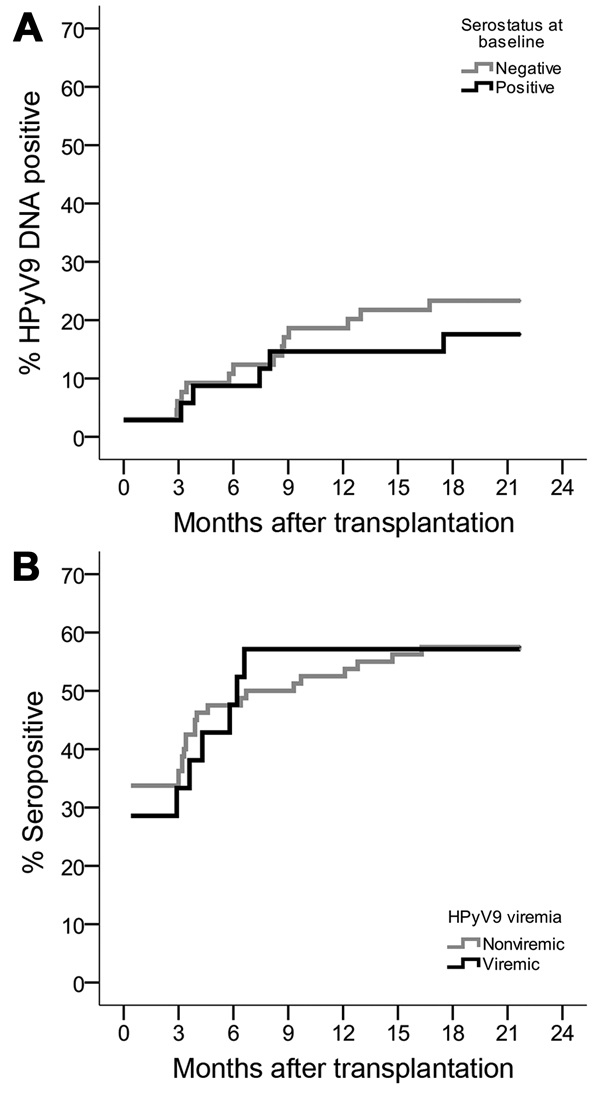
Figure 3. Kaplan-Meier curves showing proportional increase of human polyomavirus 9 (HPyV9) DNA–positive and seropositive transplant patients during 12-month follow-up, the NetherlandsA) Cumulative HPyV9 DNA positivity (viremia) for transplant patients who were seronegative (gray) or seropositive (black) at baselineB) Cumulative HPyV9 seropositivity for transplant patients who were nonviremic (gray) or viremic (black) at baseline.
Page created: March 28, 2014
Page updated: March 28, 2014
Page reviewed: March 28, 2014
The conclusions, findings, and opinions expressed by authors contributing to this journal do not necessarily reflect the official position of the U.S. Department of Health and Human Services, the Public Health Service, the Centers for Disease Control and Prevention, or the authors' affiliated institutions. Use of trade names is for identification only and does not imply endorsement by any of the groups named above.