Volume 20, Number 9—September 2014
Dispatch
Household-Level Spatiotemporal Patterns of Incidence of Cholera, Haiti, 2011
Jason K. Blackburn , Ulrica Diamond, Ian T. Kracalik, Jocelyn Widmer, Will Brown, B. David Morrissey, Kathleen A. Alexander, Andrew J. Curtis, Afsar Ali, and J. Glenn Morris
Figure 1
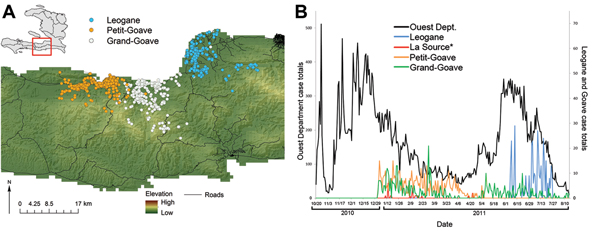
Figure 1. Findings of the Cooperative Cholera Mapping Project in Haiti, 2011. A) Geographic distribution of household cholera cases per day. B) Temporal pattern, color-coded by community, compared with reported cases in the Ouest Department (black). Color coding of map symbols in A correspond to line colors in B. La Source cases (n = 25) are plotted but not mapped.
Page created: August 14, 2014
Page updated: August 14, 2014
Page reviewed: August 14, 2014
The conclusions, findings, and opinions expressed by authors contributing to this journal do not necessarily reflect the official position of the U.S. Department of Health and Human Services, the Public Health Service, the Centers for Disease Control and Prevention, or the authors' affiliated institutions. Use of trade names is for identification only and does not imply endorsement by any of the groups named above.