Volume 21, Number 11—November 2015
Research
Association of Higher MERS-CoV Virus Load with Severe Disease and Death, Saudi Arabia, 2014
Daniel R. Feikin, Basem M. Alraddadi, Mohammed Qutub, Omaima Shabouni, Aaron Curns, Ikwo K. Oboho, Sara M. Tomczyk, Bernard J. Wolff, John T. Watson, and Tariq A. Madani
Figure 1
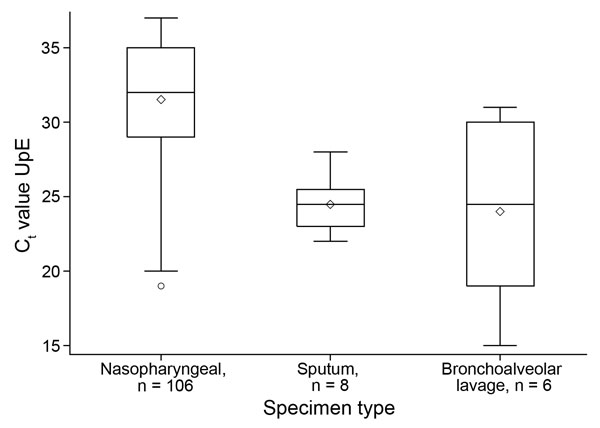
Figure 1. Box plot of Ct values for MERS-CoV patients by specimen type, Kingdom of Saudi Arabia, 2014. Box and whiskers plot features are as follows: central line in box is median, bottom line of box is first quartile (25%), top line of box is third quartile (75%), diamond is mean, bottom of whiskers is first quarter minus 1.5 × interquartile range, top of whiskers is third quarter plus 1.5 × interquartile range, and dots are outliers. Groups were compared by using the Kruskal-Wallis test, p<0.0001. Ct , cycle threshold; MERS-CoV, Middle East respiratory syndrome coronavirus; upE, upstream of E gene.
Page created: October 16, 2015
Page updated: October 16, 2015
Page reviewed: October 16, 2015
The conclusions, findings, and opinions expressed by authors contributing to this journal do not necessarily reflect the official position of the U.S. Department of Health and Human Services, the Public Health Service, the Centers for Disease Control and Prevention, or the authors' affiliated institutions. Use of trade names is for identification only and does not imply endorsement by any of the groups named above.