Volume 21, Number 3—March 2015
Dispatch
Regional Spread of Ebola Virus, West Africa, 2014
Gabriel Rainisch , Manjunath B. Shankar, Michael Wellman, Toby L. Merlin, and Martin I. Meltzer
Figure 1
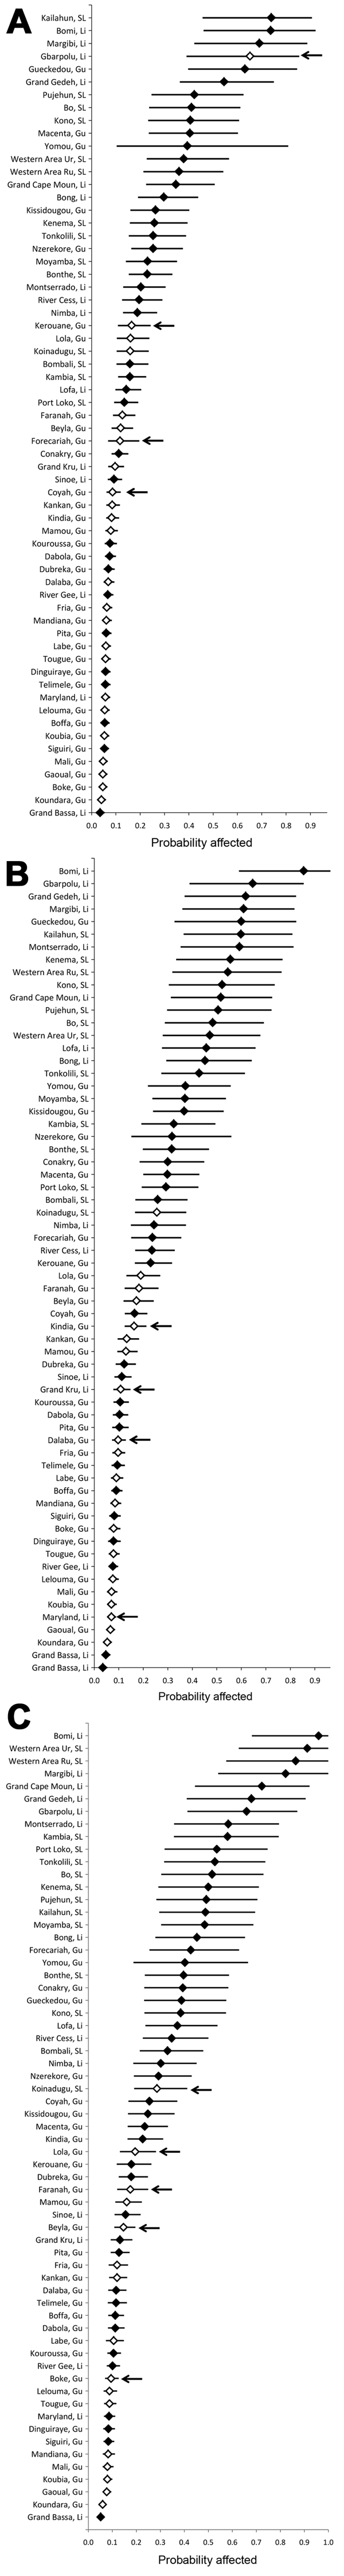
Figure 1. Probability predictions (with 95% CIs) for districts in countries primarily affected by Ebola virus infection in 2014, by week of analysis. A) Data available through week 33 (August 16). B) Data available through week 36 (September 6). C) Data available through week 39 (Sep 27). Diamonds indicate the probability that the districts should be affected at the time of the analysis. Filled diamonds indicate districts that were affected (i.e., had reported at least 1 case) at the date of the analysis. Black arrows identify those districts that became affected within 3 weeks of the date of analysis. SL, Sierra Leone; Gu, Guinea; Li, Liberia.
Page created: February 18, 2015
Page updated: February 18, 2015
Page reviewed: February 18, 2015
The conclusions, findings, and opinions expressed by authors contributing to this journal do not necessarily reflect the official position of the U.S. Department of Health and Human Services, the Public Health Service, the Centers for Disease Control and Prevention, or the authors' affiliated institutions. Use of trade names is for identification only and does not imply endorsement by any of the groups named above.