Volume 21, Number 8—August 2015
Dispatch
Seasonal Patterns of Buruli Ulcer Incidence, Central Africa, 2002–2012
Figure 1
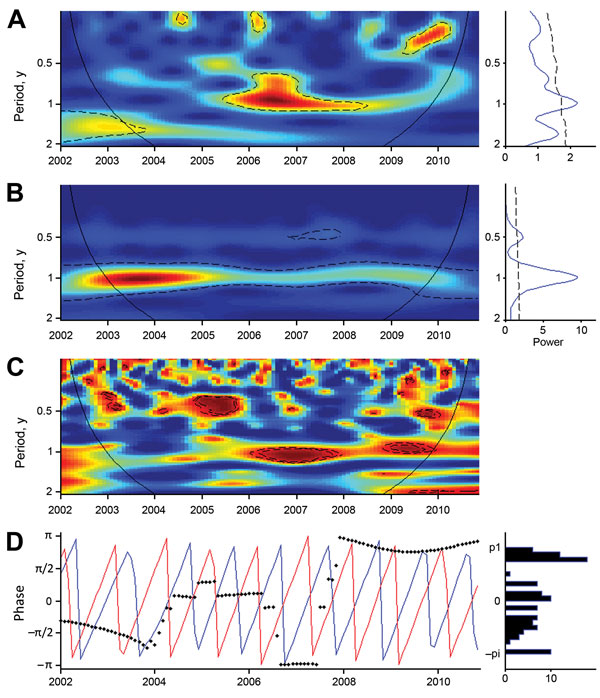
Figure 1. Wavelet analysis of Buruli ulcer (BU) case series and Nyong River flow, January 2002–December 2010. A, B) The color gradient indicates how well the wavelet of a given period adjusted with the series (power). The detection of periodic signals was performed within a confidence cone, which excluded the beginning and the end of the series where edge effects would be too likely (black solid line). Statistically significant zones are circled with dashed lines, indicating detection of significant periodic signals during the corresponding years. A) Wavelet power spectrum for the time series of BU cases: a seasonal signal with a 1-year period was detected from 2005 to 2011 (green to black), and this period was statistically significant from mid-2005 to the beginning of 2009 (dashed contour lines). B) Wavelet power spectrum for the Nyong River flow: the Nyong River flow series exhibits a statistically significant 1-year periodic signal during the whole period. C) Wavelet association between BU incidence and the Nyong River flow signal. The color gradient translates the association between the 2 signals. The dashed lines indicate statistically significant association, and the black line the confidence cone. D) Phase analysis for the 1-year period (expressed in multiples of π); BU cases are represented in blue and Nyong River flow variables in red.