Volume 21, Number 9—September 2015
Dispatch
Randomness of Dengue Outbreaks on the Equator
Figure 2
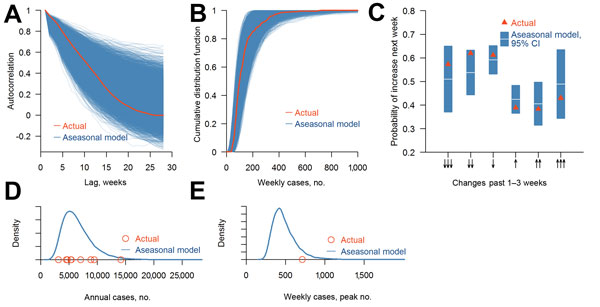
Figure 2. Comparison of observed dengue incidence and incidence from simulated aseasonal models, 2003–2012, Singapore. A) Distribution of actual and simulated autocorrelation functions at different time lags (e.g., this week versus next week; last week versus next week, etc.) B) Distribution of cumulative distribution function of the simulated weekly number of dengue cases and cumulative density function of the actual numbers of cases. C) Conditional probabilities of an increase in number of dengue cases and 95% CIs for simulated scenario and actual data, given 1–3 consecutive decreases or increases. D) Density plot of simulated and actual annual number of dengue cases. E) Density plot of simulated 10-year maximum number of cases and actual 10-year number of cases.