Volume 21, Number 9—September 2015
Dispatch
Randomness of Dengue Outbreaks on the Equator
Yirong Chen, Alex R. Cook , and Alisa X.L. Lim
Figure 1
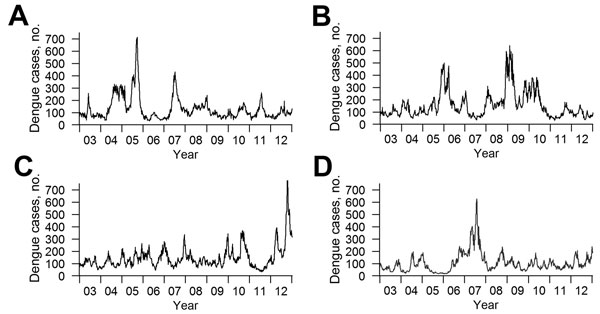
Figure 1. Weekly trends for observed and simulated dengue incidence, 2003–2012, Singapore. A) Weekly trends for the actual scenario of observed dengue incidence. B–D) Three randomly generated simulated scenarios from the aseasonal model described in the text and the Technical Appendix. Although the peaks are not synchronized, similar patterns can be discerned; large and small outbreaks of similar scale and frequency occur in all 4 scenarios.
Page created: August 14, 2015
Page updated: August 14, 2015
Page reviewed: August 14, 2015
The conclusions, findings, and opinions expressed by authors contributing to this journal do not necessarily reflect the official position of the U.S. Department of Health and Human Services, the Public Health Service, the Centers for Disease Control and Prevention, or the authors' affiliated institutions. Use of trade names is for identification only and does not imply endorsement by any of the groups named above.