Volume 21, Number 9—September 2015
THEME ISSUE
Emerging Infections Program
Emerging Infections Program
Socioeconomic Disparities and Influenza Hospitalizations, Tennessee, USA
Figure 3
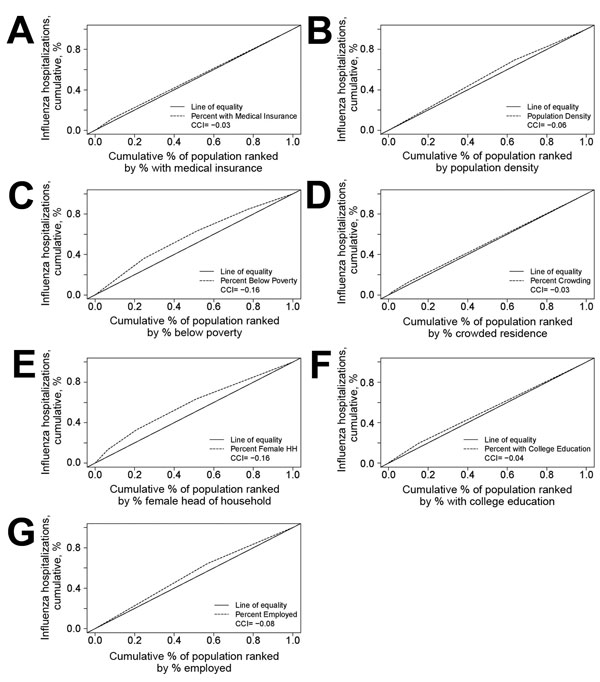
Figure 3. Concentration curves of neighborhood-level disparities in influenza hospitalizations, Middle Tennessee, USA, October 2007–April 2014. Figures show the divergence of cumulative incidence of hospitalizations for factors from the American Community Survey from the line of equality. In the absence of disparities, the dotted and dashed lines would entirely overlap. Cumulative percentage of the population hospitalized for influenza is shown for A) percentage of the population with medical insurance; B) population density; C) percentage of the population below poverty; D) percentage of the population with different levels of residential crowding; E) percentage of the population with female-headed households; F) percentage of the population with a college education; and G) percentage of the population employed. CCI, concentration curve index.