Volume 22, Number 11—November 2016
Research
Epidemiology of La Crosse Virus Emergence, Appalachia Region, United States
Sharon Bewick , Folashade Agusto, Justin M. Calabrese, Ephantus J. Muturi, and William F. Fagan
Figure 1
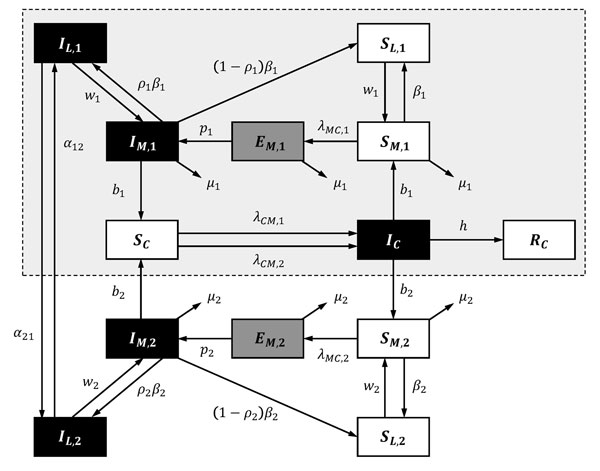
Figure 1. Schematic illustrating transitions/interactions in the compartmental model for La Crosse virus disease. Subscripted 1, 2, and C denote parameters and state variables for the eastern tree-hole mosquito, Asian tiger mosquito, and host populations, respectively. State variables and parameters are described elsewhere (see Basic Model and Table A1, at http://www.clfs.umd.edu/biology/faganlab/disease-ecology.html). Black boxes indicate infected classes; gray boxes, exposed classes; and white boxes, susceptible/recovered classes. Dashed box with gray shading demarks the subset of transitions/interactions that define the native system before tiger mosquito invasion.
Page created: October 18, 2016
Page updated: October 18, 2016
Page reviewed: October 18, 2016
The conclusions, findings, and opinions expressed by authors contributing to this journal do not necessarily reflect the official position of the U.S. Department of Health and Human Services, the Public Health Service, the Centers for Disease Control and Prevention, or the authors' affiliated institutions. Use of trade names is for identification only and does not imply endorsement by any of the groups named above.