Volume 22, Number 11—November 2016
Research
Epidemiology of La Crosse Virus Emergence, Appalachia Region, United States
Sharon Bewick , Folashade Agusto, Justin M. Calabrese, Ephantus J. Muturi, and William F. Fagan
Figure 2
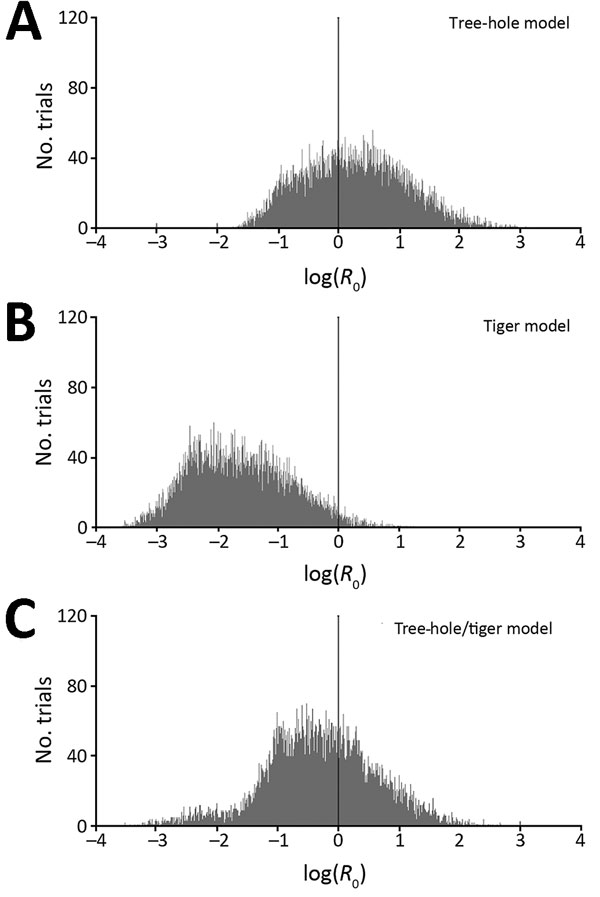
Figure 2. Histograms of basic reproduction numbers (R0) for La Crosse virus, based on Latin hypercube sampling analyses with 10,000 randomly selected parameter sets (ranges shown at http://www.clfs.umd.edu/biology/faganlab/disease-ecology.html). A) Tree-hole model, B) tiger model, and C) tree-hole and tiger model. In each panel, the black vertical line at log(R0) = 0 corresponds to the general breakpoint between growing and shrinking infection rates and thus represents the threshold for La Crosse virus disease persistence.
Page created: October 18, 2016
Page updated: October 18, 2016
Page reviewed: October 18, 2016
The conclusions, findings, and opinions expressed by authors contributing to this journal do not necessarily reflect the official position of the U.S. Department of Health and Human Services, the Public Health Service, the Centers for Disease Control and Prevention, or the authors' affiliated institutions. Use of trade names is for identification only and does not imply endorsement by any of the groups named above.