Volume 22, Number 12—December 2016
Dispatch
Time Course of MERS-CoV Infection and Immunity in Dromedary Camels
Figure
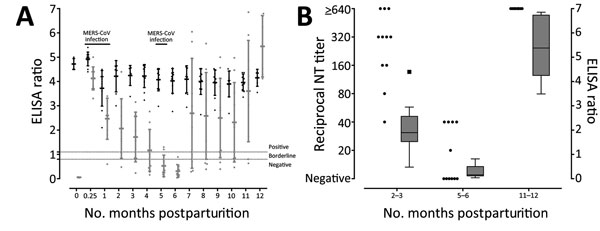
Figure. MERS-CoV–specific IgG antibody levels in dromedary camel dam–calf pairs, United Arab Emirates, 2014–2015. A) MERS-CoV spike protein S1-domain–based ELISA ratios of individual samples (dots) plus mean (horizontal line) and SD (error bars) over the course of 1 year for dams (black dots) and calves (gray dots). Ratios were calculated by dividing the ELISA optical density at 450 nm of each sample by that of a calibrator to minimize interassay variation. Dashed lines indicate cutoff values for positive (ratio 1.1) and borderline (ratio 0.8) samples. MERS-CoV infection indicates time points where MERS-CoV RNA was detected in camels. B) Neutralizing titers of individual samples from camel calves at selected time points determined by microneutralization test (dots). For comparison, ELISA ratios for the selected time points are shown in parallel as a boxplot diagram; box represents 50% of the complete dataset from the first to the third quartile, and whiskers are drawn according to the Tukey method. MERS-CoV, Middle East respiratory syndrome coronavirus; NT, neutralization test.