Unusual Ebola Virus Chain of Transmission, Conakry, Guinea, 2014–2015
Mory Keita, Sophie Duraffour, Nicholas J. Loman, Andrew Rambaut, Boubacar Diallo, Nfaly Magassouba, Miles W. Carroll, Joshua Quick, Amadou Sall, Judith R. Glynn, Pierre Formenty, Lorenzo Subissi
1
, and Ousmane Faye
1
Author affiliations: World Health Organization, Conakry, Guinea (M. Keita, B. Diallo); Bernhard Nocht Institute for Tropical Medicine, Hamburg, Germany (S. Duraffour); The European Mobile Laboratory Consortium, Hamburg (S. Duraffour, M.W. Carroll); University of Birmingham, Birmingham, UK (N.J. Loman, J. Quick); University of Edinburgh, Edinburgh, Scotland, UK (A. Rambaut); Université Gamal Abdel Nasser de Conakry, Conakry (N. Magassouba); Public Health England, Porton Down, Salisbury, UK (M.W. Carroll); University of Southampton South General Hospital, Southampton, UK (M.W. Carroll); Institut Pasteur, Dakar, Senegal (A.A. Sall, O. Faye); London School of Hygiene and Tropical Medicine, London, UK (J.R. Glynn); World Health Organization, Geneva, Switzerland (P. Formenty); European Centre for Disease Prevention and Control/World Health Organization, Conakry (L. Subissi)
Main Article
Figure 2
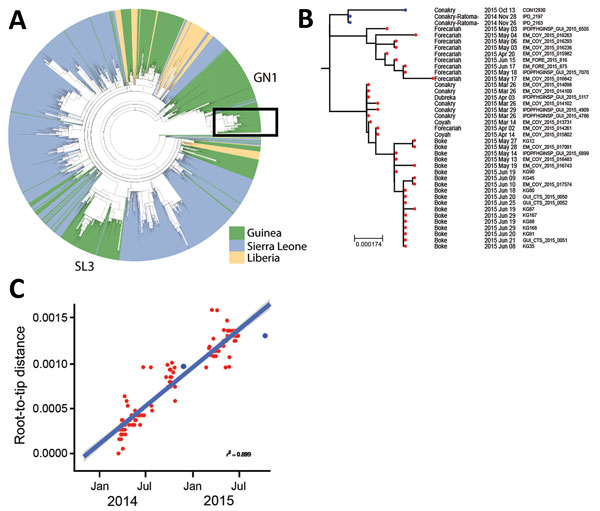
Figure 2. Phylogenetic analysis of Ebola viruses. A) Maximum-likelihood tree of 1,067 Ebola virus sequences from the West Africa epidemic, showing country of origin of each isolate. The 2 lineages that circulated in Guinea in 2015 were GN1 and SL3. Ebola virus disease cases from Conakry, Guinea, obtained in the second half of 2015 (from June on) are denoted by a red dot on the tree branches. Box indicates 2015 isolates from the GN1 lineage. B) Expanded view of the GN1 lineage from panel A. Blue dots indicate sequences from cases described in this article (survivor, IPD_2197; person who infected the survivor, IPD_2163; case-patient, CON12930); red dots indicate other cases from 2015. Sequences can be found under the European Nucleotide Archive study no. ERP011834 (http://www.ebi.ac.uk/ena/data/view/PRJEB10571). Scale bar indicates nucleotide substitutions per siite. C) Root-to-tip plot for the entire GN1 lineage; colors match those in panel B. A linear model line of best fit is shown; gray shading represents the confidence level around the regression line as SE.
Main Article
Page created: November 18, 2016
Page updated: November 18, 2016
Page reviewed: November 18, 2016
The conclusions, findings, and opinions expressed by authors contributing to this journal do not necessarily reflect the official position of the U.S. Department of Health and Human Services, the Public Health Service, the Centers for Disease Control and Prevention, or the authors' affiliated institutions. Use of trade names is for identification only and does not imply endorsement by any of the groups named above.