Volume 22, Number 2—February 2016
Research
Prognostic Indicators for Ebola Patient Survival
Samuel J. Crowe1 , Matthew J. Maenner1 , Solomon Kuah, Bobbie Rae Erickson, Megan Coffee, Barbara Knust, John D. Klena, Joyce Foday, Darren Hertz, Veerle Hermans, Jay Achar, Grazia M. Caleo, Michel Van Herp, César G. Albariño, Brian Amman, Alison Jane Basile, Scott Bearden, Jessica A. Belser, Eric Bergeron, Dianna Blau, Aaron C. Brault, Shelley Campbell, Mike Flint, Aridth Gibbons, Christin Goodman, Laura McMullan, Christopher D. Paddock, Brandy Russell, Johanna S. Salzer, Angela Sanchez, Tara Sealy, David Wang, Gbessay Saffa, Alhajie Turay, Stuart T. Nichol, and Jonathan S. Towner
Figure 2
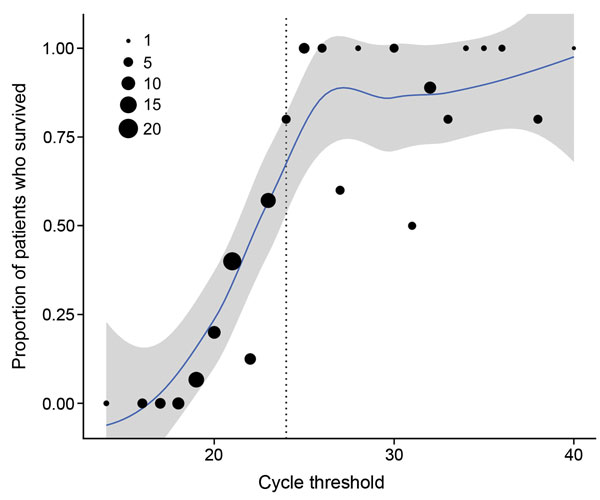
Figure 2. Percent survival among 151 patients in the Ebola virus disease (EVD) primary cohort by cycle threshold (Ct) rounded to nearest integer, Bo District, Sierra Leone, September 2014–January 2015. Locally weighted smoothing line and 95% uncertainty intervals added to illustrate trend. The area of each dot is scaled to represent the number of confirmed EVD cases, by Ct. The trend line suggests a sharp increase in survival for patients with Ct values in the mid-20s (dotted line).
1These authors contributed equally to this article.
Page created: January 14, 2016
Page updated: January 14, 2016
Page reviewed: January 14, 2016
The conclusions, findings, and opinions expressed by authors contributing to this journal do not necessarily reflect the official position of the U.S. Department of Health and Human Services, the Public Health Service, the Centers for Disease Control and Prevention, or the authors' affiliated institutions. Use of trade names is for identification only and does not imply endorsement by any of the groups named above.