Volume 23, Number 10—October 2017
Research Letter
Autochthonous Transmission of East/Central/South African Genotype Chikungunya Virus, Brazil
Figure
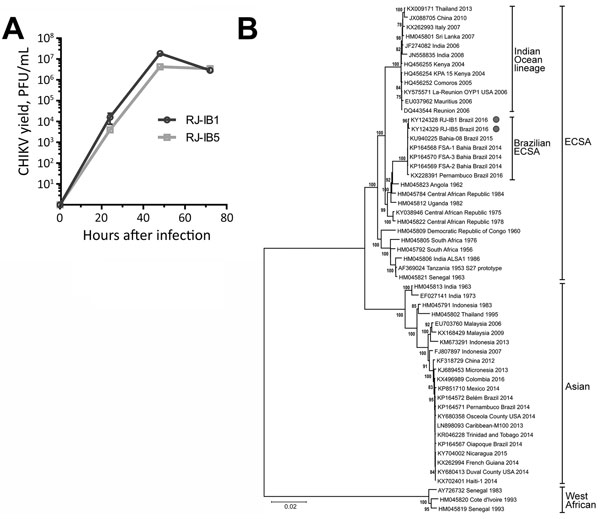
Figure. Growth curve and phylogenetic analysis of RJ-IB1 and RJ-IB5 CHIKV isolates, Rio Janeiro, Brazil, 2016. A) Vero cell–amplified RJ-IB1 or RJ-IB5 was titrated and used to infect Vero cells in duplicates at a multiplicity of infection of 0.05. The resulting supernatants were harvested at 0, 24, 48, and 72 h after infection. The production of infectious progeny was determined by plaque assay in Vero cells. B) The full-genome sequences of RJ-IB1 and RJ-IB5 isolates and 53 CHIKV strains representing all known genotypes were aligned with MAFFT (http://mafft.cbrc.jp/alignment/software). Phylogeny inference was performed with MEGA 6 (http://www.megasoftware.net) opting for the neighbor-joining method and kimura-2p model of substitution. Numbers on branches indicate the percentage of bootstrap support from 1,000 replicates. Values >70% are shown. Similar tree topology was obtained with maximum-likelihood method opting for Tamura-Nei model of substitution. Isolates are identified by GenBank accession number, location, and year of CHIKV isolation; genotypes are indicated at right. CHIKV, chikungunya virus; ESCA, East/Central/South African genotype. Scale bar indicates nucleotide substitutions per site.