Volume 23, Number 12—December 2017
Research
Distribution of Usutu Virus in Germany and Its Effect on Breeding Bird Populations
Renke Lühken , Hanna Jöst, Daniel Cadar, Stephanie Margarete Thomas, Stefan Bosch, Egbert Tannich, Norbert Becker, Ute Ziegler, Lars Lachmann, and Jonas Schmidt-Chanasit
Figure 3
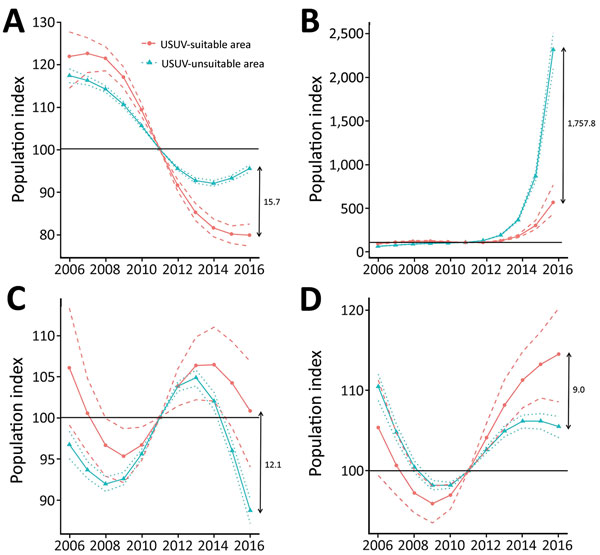
Figure 3. Index curves of the generalized additive model (GAM) approach with 300 bootstraps for breeding bird survey data of 4 bird species for Usutu virus (USUV)–suitable and USUV-unsuitable areas in Germany, 2016. A) Common blackbird; B) Eurasian tree sparrow; C) house sparrow; D) great tit. Solid lines indicate the mean indices from a GAM with 3 df; dashed/dotted lines represent nonoverlapping 95% bootstrap CIs. The horizontal line indicates the baseline year 2011 (index = 100), which is the last time point when bird abundance data were collected before the first known epizootic outbreak of USUV in Germany. Double arrows indicate the difference between the mean index curves for 2016.
Page created: November 16, 2017
Page updated: November 16, 2017
Page reviewed: November 16, 2017
The conclusions, findings, and opinions expressed by authors contributing to this journal do not necessarily reflect the official position of the U.S. Department of Health and Human Services, the Public Health Service, the Centers for Disease Control and Prevention, or the authors' affiliated institutions. Use of trade names is for identification only and does not imply endorsement by any of the groups named above.