Volume 23, Number 3—March 2017
Research
Spatiotemporal Fluctuations and Triggers of Ebola Virus Spillover
John Paul Schmidt , Andrew W. Park, Andrew M. Kramer, Barbara A. Han, Laura W. Alexander, and John M. Drake
Figure 1
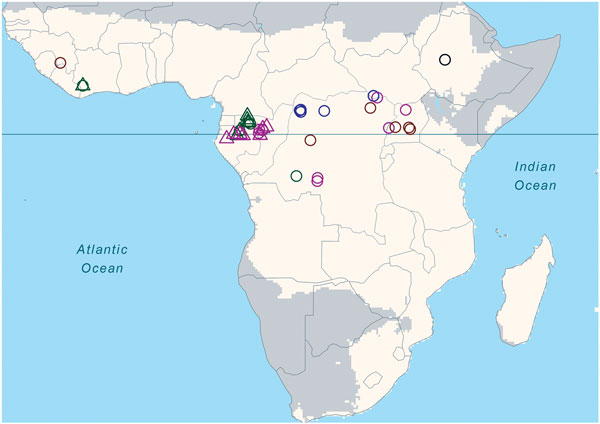
Figure 1. Locations of known Ebola virus spillover events, Africa, 1960–2010. Light-shaded area indicates the focal region in Africa of annual rainfall >500 mm. Open circles indicate human spillovers, open triangles infection/mortality in nonhuman primates or in other mammals. Yellow, blue, green, magenta, and black indicate the 5 respective decades during 1960–2010. Solid horizontal line marks the equator. No known Ebola spillovers occurred in the 1980s.
Page created: February 24, 2017
Page updated: February 24, 2017
Page reviewed: February 24, 2017
The conclusions, findings, and opinions expressed by authors contributing to this journal do not necessarily reflect the official position of the U.S. Department of Health and Human Services, the Public Health Service, the Centers for Disease Control and Prevention, or the authors' affiliated institutions. Use of trade names is for identification only and does not imply endorsement by any of the groups named above.