Volume 23, Number 3—March 2017
Research
Spatiotemporal Fluctuations and Triggers of Ebola Virus Spillover
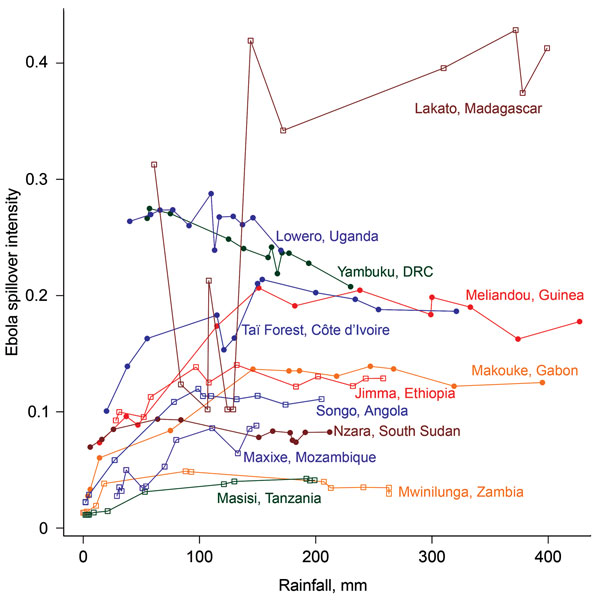
Figure 3

Figure 3. Phase graph showing the relationship between mean monthly rainfall and raw Ebola spillover intensity (defined as average density or expected number of points per unit area and/or time) for known Ebola virus disease locations in West and Central Africa (closed circles) and locations in northeastern or southern Africa where model results indicate moderate to high Ebola spillover intensity seasonally (open squares). Points are ordered by least to greatest monthly rainfall at each site. DRC, Democratic Republic of the Congo.
Page created: February 24, 2017
Page updated: February 24, 2017
Page reviewed: February 24, 2017
The conclusions, findings, and opinions expressed by authors contributing to this journal do not necessarily reflect the official position of the U.S. Department of Health and Human Services, the Public Health Service, the Centers for Disease Control and Prevention, or the authors' affiliated institutions. Use of trade names is for identification only and does not imply endorsement by any of the groups named above.