Volume 23, Number 3—March 2017
Dispatch
Genetically Diverse Filoviruses in Rousettus and Eonycteris spp. Bats, China, 2009 and 2015
Xing-Lou Yang1, Yun-Zhi Zhang1, Ren-Di Jiang1, Hua Guo, Wei Zhang, Bei Li, Ning Wang, Li Wang, Cecilia Waruhiu, Ji-Hua Zhou, Shi-Yue Li, Peter Daszak, Lin-Fa Wang, and Zheng-Li Shi
Figure 2
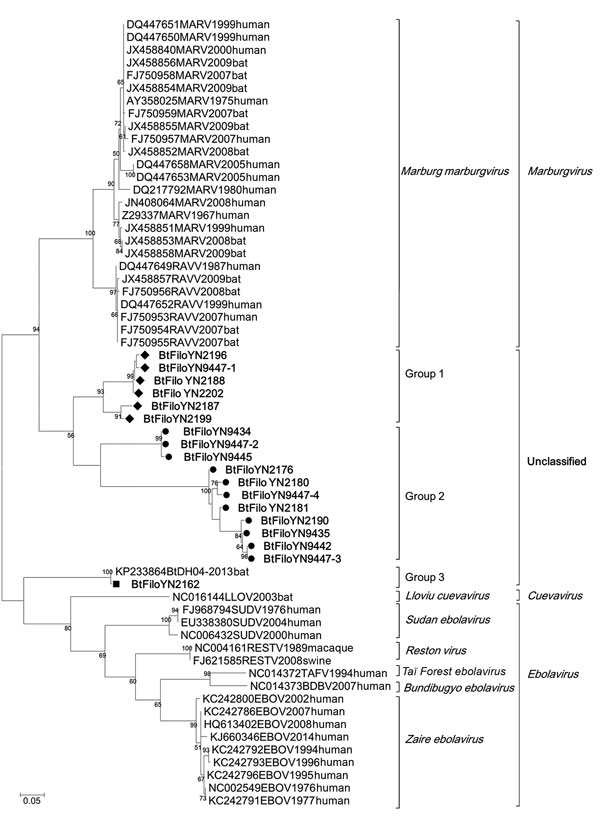
Figure 2. Phylogenetic analysis of filovirus isolates collected in study of genetically diverse filoviruses in Rousettus and Eonycteris spp. bats in China, compared with reference isolates. Analysis was based on a 310-bp segment of the filovirus L gene. Bootstrap values lower than 50 are not shown. The maximum-likelihood tree was constructed based on the 310-bp segment with 1,000 bootstrap replicates. The sequences obtained in this study are marked with a triangle (group 1), black dot (group 2), or rectangle [group 3). Sequences from GenBank are listed by their accession numbers, followed by the virus name, collection year, and host. Scale bar indicates nucleotide substitutions per site.
1These authors contributed equally to this article.
Page created: February 23, 2017
Page updated: February 23, 2017
Page reviewed: February 23, 2017
The conclusions, findings, and opinions expressed by authors contributing to this journal do not necessarily reflect the official position of the U.S. Department of Health and Human Services, the Public Health Service, the Centers for Disease Control and Prevention, or the authors' affiliated institutions. Use of trade names is for identification only and does not imply endorsement by any of the groups named above.