Skip directly to site content Skip directly to page options Skip directly to A-Z link Skip directly to A-Z link Skip directly to A-Z link
Volume 23, Number 4—April 2017
Research

Plasmodium malariae Prevalence and csp Gene Diversity, Kenya, 2014 and 2015

Eugenia LoComments to Author , Kristie Nguyen, Jennifer Nguyen, Elizabeth Hemming-Schroeder, Jiaobao Xu, Harrisone Etemesi, Andrew Githeko, and Guiyun YanComments to Author 
Author affiliations: University of California Irvine, Irvine, California, USA (E. Lo, K. Nguyen, J. Nguyen, E. Hemming-Schroeder, G. Yan); Southern Medical University, Guangzhou, China (J. Xu); Kenya Medical Research Institute, Kisumu, Kenya (H. Etemesi, A. Githeko)

Main Article

Figure 5

Comparison of circumsporozoite protein (csp) gene sequence divergence among Plasmodium isolates from different geographic regions. A) Pairwise genetic distance plot of all amino acid positions of the csp gene. The matrix-normalized distances based on the standard point accepted mutation (Dayhoff–PAM) model that account for the probability of change from 1 amino acid to another were calculated. Samples were analyzed as a whole and partitioned by geographic regions as indicated by colors. B) Dot p

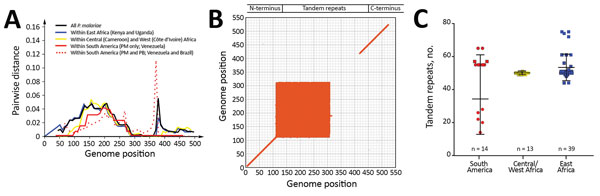
Figure 5. Comparison of circumsporozoite protein (csp) gene sequence divergence among Plasmodium isolates from different geographic regions. A) Pairwise genetic distance plot of all amino acid positions of the csp gene. The matrix-normalized distances based on the standard point accepted mutation (Dayhoff–PAM) model that account for the probability of change from 1 amino acid to another were calculated. Samples were analyzed as a whole and partitioned by geographic regions as indicated by colors. B) Dot plot showing matching scores, a proxy of sequence similarity, between pairwise samples calculated based on the standard Dayhoff–PAM matrix. The greatest mismatch was detected at amino acid positions 110–310, representing the 3′ N terminal through the central repeat regions. C) Variation in the number of tandem repeats in the central region of the csp gene. The greatest length variation was observed in the isolates from South America despite the fact that both P. malariae (PM) and P. brasilianum (PB) were included. P. malariae from East Africa was more variable in the number of repeats than isolates from Central/West Africa, despite difference in sample size. Median, first quartile, and fourth quartile of the data are shown for each sample category (horizontal lines). Red represents samples from South America; yellow, Central/West Africa; blue, East Africa. Circles represent P. brasilianum; squares, P. malariae.

Main Article

Page created: March 16, 2017
Page updated: March 16, 2017
Page reviewed: March 16, 2017
The conclusions, findings, and opinions expressed by authors contributing to this journal do not necessarily reflect the official position of the U.S. Department of Health and Human Services, the Public Health Service, the Centers for Disease Control and Prevention, or the authors' affiliated institutions. Use of trade names is for identification only and does not imply endorsement by any of the groups named above.
file_external