Volume 23, Number 4—April 2017
Dispatch
Zika Virus Seroprevalence, French Polynesia, 2014–2015
Maite Aubry , Anita Teissier, Michael Huart, Sébastien Merceron, Jessica Vanhomwegen, Claudine Roche, Anne-Laure Vial, Sylvianne Teururai, Sébastien Sicard, Sylvie Paulous, Philippe Desprès, Jean-Claude Manuguerra, Henri-Pierre Mallet, Didier Musso, Xavier Deparis, and Van-Mai Cao-Lormeau
Figure
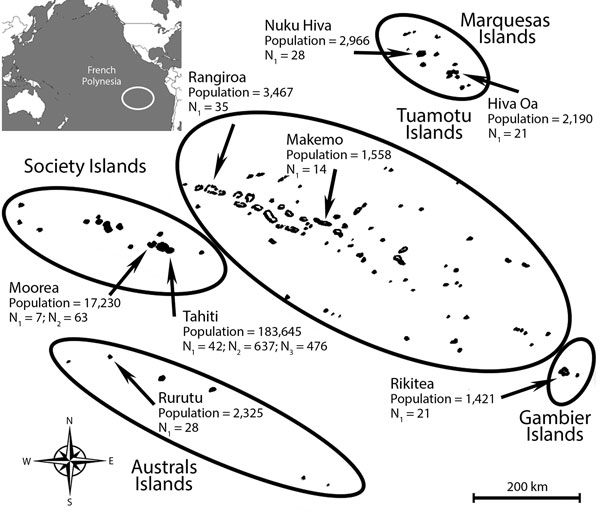
Figure. Geographic distribution of participants recruited for a study of the postemergence seroprevalence of Zika virus infections in French Polynesia, 2014–2015. N1 and N2 indicate areas of recruitment among the general population during February and March 2014 and September–November 2015, respectively; N3 indicates areas of recruitment among schoolchildren during May and June 2014. The total population and number of recruited participants is shown for each area. Lines delineate the 5 archipelagos that comprise French Polynesia (Marquesas, Society, Tuamotu, Gambier, and Australs). Inset map at upper left shows location of French Polynesia in the Pacific Ocean (white circle).
Page created: March 16, 2017
Page updated: March 16, 2017
Page reviewed: March 16, 2017
The conclusions, findings, and opinions expressed by authors contributing to this journal do not necessarily reflect the official position of the U.S. Department of Health and Human Services, the Public Health Service, the Centers for Disease Control and Prevention, or the authors' affiliated institutions. Use of trade names is for identification only and does not imply endorsement by any of the groups named above.