Volume 24, Number 12—December 2018
Research
Spatial Analysis of Wildlife Tuberculosis Based on a Serologic Survey Using Dried Blood Spots, Portugal
Nuno Santos1 , Telmo Nunes, Carlos Fonseca, Madalena Vieira-Pinto, Virgílio Almeida, Christian Gortázar, and Margarida Correia-Neves
Figure 1
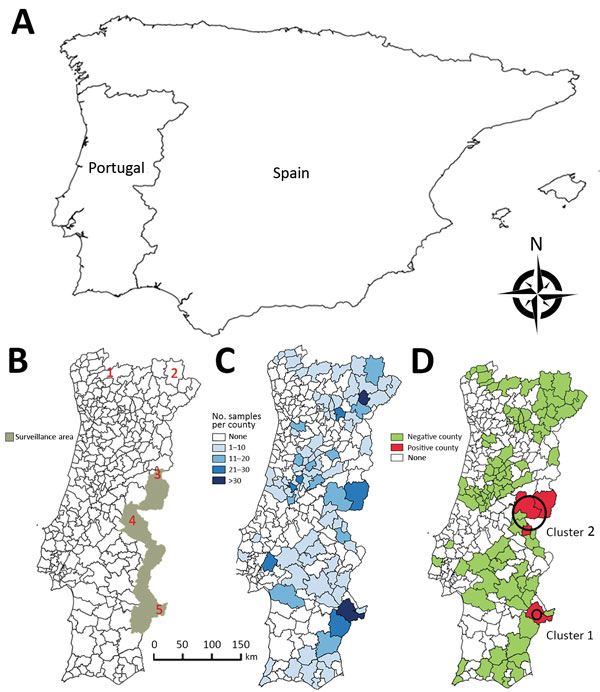
Figure 1. Choropleth maps for spatial study of bovine tuberculosis (TB) in wildlife, Portugal. A) Iberian Peninsula. B) Official surveillance area for bovine TB in large game species. Red numbers indicate historical population refuges of wild ungulates: 1) Gerês, 2) Montesinho, 3) Malcata, 4) São Mamede, and 5) left bank of the Guadiana River. C) Distribution of serologic samples analyzed per county. D) Distribution of bovine TB–positive samples. Black circles indicate the 2 clusters identified.
1Current affiliation: Research Centre in Biodiversity and Genetic Resources, University of Porto,Vairão, Portugal.
Page created: November 19, 2018
Page updated: November 19, 2018
Page reviewed: November 19, 2018
The conclusions, findings, and opinions expressed by authors contributing to this journal do not necessarily reflect the official position of the U.S. Department of Health and Human Services, the Public Health Service, the Centers for Disease Control and Prevention, or the authors' affiliated institutions. Use of trade names is for identification only and does not imply endorsement by any of the groups named above.