Skip directly to site content Skip directly to page options Skip directly to A-Z link Skip directly to A-Z link Skip directly to A-Z link
Volume 24, Number 12—December 2018
CME ACTIVITY - Synopsis

Reemergence of St. Louis Encephalitis Virus in the Americas

Adrián DiazComments to Author , Lark L. Coffey, Nathan Burkett-Cadena, and Jonathan F. Day
Author affiliations: Universidad Nacional de Córdoba, Córdoba, Argentina (A. Diaz); University of California, Davis, California, USA (L.L. Coffey); University of Florida, Vero Beach, Florida, USA (N. Burkett-Cadena, J.F. Day)

Main Article

Figure 2

Phylogeny and spread of St. Louis encephalitis virus (SLEV) in the Americas. A) Multiple sequence alignment of 44 complete envelope protein SLEV sequences obtained from GenBank. The orange highlighted cluster contained the emerging SLEV strains isolated in Argentina, Brazil, and western United States. Alignment was performed by ClustalX, followed by tree generation using a neighbor-joining algorithm using MEGA 6 software (https://www.megasoftware.net). Sequences are labeled by their GenBank acce

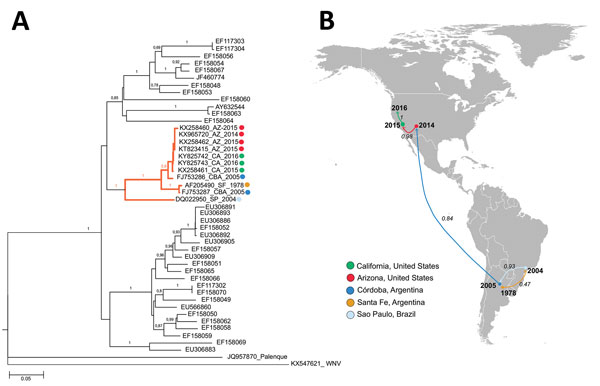
Figure 2. Phylogeny and spread of St. Louis encephalitis virus (SLEV) in the Americas. A) Multiple sequence alignment of 44 complete envelope protein SLEV sequences obtained from GenBank. The orange highlighted cluster contained the emerging SLEV strains isolated in Argentina, Brazil, and western United States. Alignment was performed by ClustalX, followed by tree generation using a neighbor-joining algorithm using MEGA 6 software (https://www.megasoftware.net). Sequences are labeled by their GenBank accession number. Sequences belonging to lineage III also contain place and year of isolation data. Bootstrap support values are given for each node. Scale bar represents nucleotide substitutions per site. B) Geographic spread of SLEV. A discrete Bayesian phylogeographic reconstruction for SLEV lineage III was made using 11 envelope protein sequences (highlighted cluster in , panel A). We applied a constant-size coalescent tree before the phylogeny and a TNF93 nt substitution model. The Monte Carlo Markov chain model was obtained after 30 million iterations and subsampling every 20.000 iterations. Analyses were made using Beast version 1.8.3 software (http://tree.bio.ed.ac.uk/software/beast/). Numbers over the arrows indicate the probability for the postulated viral dispersion in that pathway. Color of arrows indicates the location origin for the strain introduced.

Main Article

Page created: November 15, 2018
Page updated: November 15, 2018
Page reviewed: November 15, 2018
The conclusions, findings, and opinions expressed by authors contributing to this journal do not necessarily reflect the official position of the U.S. Department of Health and Human Services, the Public Health Service, the Centers for Disease Control and Prevention, or the authors' affiliated institutions. Use of trade names is for identification only and does not imply endorsement by any of the groups named above.
file_external