Volume 24, Number 12—December 2018
Synopsis
Restaurant Inspection Letter Grades and Salmonella Infections, New York, New York, USA
Cite This Article
Citation for Media
Abstract
Rates of Salmonella infection in the United States have not changed over the past 20 years. Restaurants are frequent settings for Salmonella outbreaks and sporadic infections. Few studies have examined the effect of posting letter grades for restaurant inspections on the incidence of foodborne illness. We compared Salmonella infection rates in New York, New York, USA (NYC), with those in the rest of New York state before and after implementation of a letter grade system for restaurant inspections in NYC. We calculated a segmented regression model for interrupted time series data. After implementation of letter grading, the rate of Salmonella infections decreased 5.3% per year in NYC versus the rest of New York state during 2011–2015, compared with the period before implementation, 2006–2010. Posting restaurant inspection results as letter grades at the point of service was associated with a decline in Salmonella infections in NYC and warrants consideration for broader use.
Each year, an estimated 48 million persons get sick, 128,000 are hospitalized, and 3,000 die from foodborne illness in the United States (1). Consumption of food prepared away from home, such as at restaurants and for takeout, has continuously increased, accounting for 50% of food expenditures in 2014, up from 33% in 1970 (2). Restaurants are frequent settings for transmission of foodborne illness; in 2015, 60% of foodborne illness outbreaks were associated with restaurants (3). There is also evidence that commercial food service establishments, such as restaurants, play a role in sporadic (nonoutbreak) cases of foodborne illness (4). Given our dependence on food prepared away from home, reducing the risk for foodborne illness from commercial food service establishments is of critical importance.
Food service establishments play a role in the epidemiology of Salmonella infections; Salmonella may contaminate a wide range of raw ingredients, infect food workers, survive on contaminated surfaces, and grow in improperly held food items. Nontyphoidal Salmonella infections are the second most common foodborne illness and the leading cause of foodborne illness hospitalizations and death (1). Reducing Salmonella infections is a Healthy People 2020 objective (5), yet rates have not substantially changed over the last 20 years (6). Inspection of food service establishments to protect food safety is a core function of state and local health departments; the inspections help to identify risk factors for foodborne illness, such as those associated with Salmonella transmission, and to correct them, thus protecting consumers and industry.
New York does not have a statewide policy for reporting restaurant inspection results. In 2005, the Department of Health and Mental Hygiene (DOHMH) in New York, NY, USA (NYC), began using a point-scoring system for food service establishment inspections to weight violations to reflect risk factors for foodborne illness. In 2010, the NYC DOHMH implemented a letter grade program that converted these scores into categorical rankings of A, B, or C, or grade pending, in an effort to improve restaurant food safety, increase transparency of inspection information, and reduce the risk for foodborne illness transmission in restaurants (7). The DOHMH required establishments to post a sign with the letter grade in its window so that consumers could see it before entering. Public disclosure programs like this one seek to provide information to consumers when and where they need it so they can make informed decisions about potential risks (8). These consumer decisions encourage restaurant operators to improve and maintain sanitary standards, thus improving sanitary conditions in restaurants. The letter grade program has already been shown to lead to improvements in sanitary conditions in NYC: 35% more restaurants earned A grades in the 3 years after grading, compared with the 3 years before (9).
The value of posting restaurant inspection ratings at the point of service has been the subject of considerable debate. Few studies have looked at the impact of posting policies on the incidence of foodborne illness. Two studies of a letter grade program in Los Angeles County, California, USA, showed a reduction in foodborne-illness hospitalizations (10,11). In NYC, a preliminary analysis of letter grading at 18 months suggested a decline in Salmonella infections. The goal of our study was to compare the incidence of Salmonella infections in NYC with incidence in the rest of the state before and after the implementation of posting letter grade placards at the point of service.
Data
Salmonella infections are nationally notifiable (12). We obtained yearly laboratory-confirmed case counts from 1994–2015 from the NYC DOHMH and the New York State Department of Health. Cases are reported by year of diagnosis and county of residence.
Statistical Analyses
To account for population changes, we calculated annual rates using intercensal population estimates for 1994–2015 from the US Census Bureau. We calculated the percent change from year to year. We compared mean rates of Salmonella infection before and after implementation of a point scoring system in 2005 and after implementation of grade cards in 2010 using t-tests for NYC and the rest of the state (NYS). We considered the year of implementation to be a part of the before period in both analyses because the policies were not implemented on January 1 of each year.
We used segmented regression to determine the trend before implementing the policy in Salmonella infections, an immediate change at the time of policy implementation, and the long-term trend after policy implementation (13). We hypothesized that the long-term trend would decline after policy implementation. We expected a delayed effect because restaurants are not all on the same inspection cycle and because underlying improvements in sanitation driving the decline are not likely to be immediate. Because there were indications of overdispersion and heteroskedasticity, we used a negative binomial regression model with robust SEs to quantify the effect of letter grade placards on Salmonella infections. We used an offset term to account for population changes across the period. Examination of autocorrelation and partial autocorrelation functions confirmed that the outcome was not autocorrelated. We calculated incidence rate ratios (IRR) comparing Salmonella infections in NYC to NYS before and after the implementation of the point scoring system and posting of letter grade placards.
Key variables included year, coded as a continuous variable starting with 1994 = 1; variables representing the 2 policy periods (prepolicy = 0, postpolicy = 1); 2 variables representing the trends after policy implementation, coded as 0 before the policy and a continuous numerical function after the policy was implemented; and a variable (region) representing NYC versus NYS. The model also included 5 interaction terms: region by year, to control for regional secular trends; region by policy for each policy (before and after letter grade was implemented), to account for the mean level change in NYC after the new policy took effect; and region by trend before and after policy implementation, to determine if the average Salmonella infections in NYC changed after policy implementation versus NYS (14). We also conducted a subanalysis using data from 2000–2015 to compare NYC to surrounding counties (NYC metropolitan area) and NYS. We analyzed data using Stata version 14.2 (StataCorp LLC, College Station, TX, USA) and determined statistical significance as p<0.05.
Figure
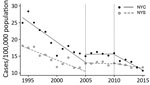
Figure. Confirmed Salmonella infection cases per 100,000 population in NYC and the rest of the state, 1994–2015. Dashed lines indicate implementation of point scores in 2005 and letter grades in 2010. NYC,...
The annual rate of Salmonella infections decreased in both NYC and NYS during 1994–2015 (Table 1; Figure). The period-to-period percent change after letter grading implementation was a decline of 32.6% in NYC, compared with a decline of 14.1% in NYS (Table 1). Mean Salmonella infection rates in NYC between 1994 and 2010 were significantly higher (p<0.01) than in NYS (Table 2). In the period after letter grading was implemented (2011–2015), the mean rate of Salmonella infection was no longer significantly different (p = 0.37) in NYC (mean 12.6 cases/100,000 persons; 95% CI 10.9–14.4) compared with NYS (mean 12.0 cases/100,000 persons; 95% CI 11.4–12.6).
In NYC and NYS, Salmonella infections were decreasing before either policy was implemented in NYC (IRR 0.95; 95% CI 0.94–0.96; p<0.01). The interaction term for trend by region after letter grade implementation was statistically significant (p<0.01), which indicates that Salmonella infection rates declined on average in NYC versus NYS in the years after letter grading was implemented, compared with the period after the point scoring system was implemented (Table 3). After letter grading was implemented, the rate of Salmonella infections decreased 5.3% per year in NYC versus NYS (IRR 0.95; 95% CI 0.92–0.98; p<0.01).
In a subanalysis of Salmonella infections from 2000–2015 comparing number of infections in NYC with that of other counties in the NYC metropolitan area and NYS separately, Salmonella infections declined in both NYC and the NYC metropolitan area compared with those in NYS. In contrast to the findings in NYS, in the period after letter grading was implemented, NYC Salmonella infections declined 8.8% per year and Salmonella infections in the NYC metropolitan area declined 7.5% per year compared with the period between the implementation of a point scoring system and the letter grade program.
Overall, Salmonella infections declined in NYC and NYS between 1994 and 2015. Although NYS had declines in Salmonella infection rates after 2010, NYC saw declines greater than those in NYS. Inspection processes were largely unchanged in NYC with the implementation of the point scoring system in 2005 (15). The letter grade placard program begun in 2010 did not change the point scoring system but rather used the points to create a readily comprehensible ranking system accessible at the point of service. Our analysis supports the hypothesis that having a point scoring system was not associated with declines in Salmonella infections but having a simple way to publicly disclose the results of the inspection was.
Although it appears that the implementation of a point scoring system in NYC was associated with a leveling off of declines in Salmonella infections, the system was implemented at the end of a hyperendemic period of Salmonella enterica serotype Enteriditis infections. In the 1980s, high rates of Salmonella Enteriditis infections primarily associated with shell eggs were recognized, and a variety of prevention and control measures were put in place to combat these rising rates (16). The Northeast was particularly affected by this outbreak; New York state reported the highest number of outbreaks during 1985–1999 (16). Prevention measures appeared to have the greatest success in reducing rates in the Northeast compared with others (16). Furthermore, 2 notable changes in NYC during this time period led to improved surveillance, which typically results in better detection and reporting. In 2006, the NYC Board of Health mandated electronic laboratory reporting of notifiable diseases (17); in 2009, NYC became a Foodborne Diseases Centers for Outbreak Response Enhancement (FoodCORE) center with the goal of improving surveillance for Salmonella infections (18). To the extent that these efforts may have improved surveillance in NYC, they may also have been expected to increase case detection in NYC versus NYS.
The implementation of letter grading in 2010 marks the beginning of the current declining trend in Salmonella infections. By improving sanitation conditions in NYC food service establishments, the letter grade program can be expected to benefit other areas as well. In this study, Salmonella infection were reported by county of residence, but NYC sees its population change daily due to commuting and tourism. Manhattan, one of the 5 NYC boroughs, sees its population nearly double during the workday. Of its commuters, 36% (≈550,000 persons) travel from outside the other 4 boroughs (19). Additionally, NYC is a popular place for tourists; >60 million persons visited in 2016 (20). Our study showed that Salmonella infections in NYS declined after the letter grade program was implemented. This finding may be in part because improved sanitary conditions in NYC restaurants after the implementation of letter grades reduced risk for Salmonella exposure among NYS residents who commuted to or visited NYC.
This study had several limitations. First, this was a quasi-experimental, ecologic study that represents an association and not a causal relationship. Second, the NYC restaurant letter grade program involved multiple changes to sanitation enforcement in addition to letter grade posting; changes included inspection frequency, greater risk for fines, improvements to online resources, and additional training opportunities (21). As a result, we could not determine which factors contributed the most to the reduction in Salmonella infections. Furthermore, we were not able to assess whether Salmonella-infected persons had a known exposure to restaurants in the period before illness.
This study supports findings from an earlier NYC study (21) and previous studies of Los Angeles County that showed a decline in foodborne illness hospitalizations. Hospitalizations represent a subset of foodborne illnesses that may be caused by a variety of agents, such as Campylobacter, another leading cause of foodborne illness in the United States (1). However, Campylobacter rarely causes outbreaks in restaurant settings because its biology limits transmission to inadequate cooking of contaminated poultry or meats or cross-contamination from raw to ready-to-eat foods (22). As a result, improvements in restaurant sanitary conditions are unlikely to affect Campylobacter transmission in restaurants.
In contrast, the selection of Salmonella infections is a strength of this study because the biology of Salmonella makes it uniquely suited for transmission in food service establishments. In restaurants, Salmonella can cause illness from contaminated raw ingredients, through cross-contamination, or from infected food workers. Improper cooling of inadequately cooked foods, or failure to maintain cold or hot holding temperatures can amplify contamination. Thus, Salmonella transmission serves as a good indicator of overall restaurant food safety practices.
Despite limitations, NYC’s experience provides a useful case study of the beneficial effect of letter grading programs. Although the relationship between restaurant inspections and risk for foodborne illness is not well understood (23) and inspections represent a snapshot in time that may not represent the overall sanitary conditions in restaurants, factors related to food handling and preparation practices and food worker health and hygiene are frequent contributors to outbreaks in restaurants (24). These factors probably contribute to transmission of sporadic infections in restaurants, which are much more common; outbreak cases represent <10% of all Salmonella infections (4,6). The NYC restaurant letter grade program has been shown to be associated with sustained improvements in sanitary conditions in restaurants, including several factors associated with outbreaks (9). Furthermore, that study showed that after 18 months, 81% of adults in NYC had seen letter grade placards, and 88% of those persons considered the letter grades in their dining decisions (9). This finding suggests that consumer behavior helped support the program goal of driving improvements in sanitary conditions. Although future studies are needed to parse which restaurant inspection results may contribute most to declines in Salmonella infections, our findings support the hypothesis that the successful implementation of a letter grade program was associated with a reduction of Salmonella transmission in restaurants in NYC.
In conclusion, in the United States, considerable resources have been invested to prevent contamination of the food supply before the point of service. However, Salmonella infections remain unchanged at the national level. Previous studies have shown improvements in sanitary conditions after the implementation of the NYC restaurant letter grade program, and our study suggests a beneficial effect on the incidence of foodborne illnesses. Implementing a letter grade program is a feasible and relatively inexpensive tool to reduce Salmonella infections that warrants consideration for broader use. Other jurisdictions should consider adopting a letter grade program and decide on the form and location of the placard, frequency of inspections, and approaches to engage restaurant-industry and community support to ensure program success.
Ms. Firestone is a doctoral candidate at the University of Minnesota. Her primary research focuses on using surveillance data to inform policy targeted toward reducing foodborne illness.
Dr. Hedberg is a professor at the University of Minnesota. His primary research focuses on improving surveillance of foodborne illness and food safety hazards with the goal of reducing the burden of foodborne illness.
Acknowledgment
We thank Andrew Ryan and Joseph Servadio for analytic consultations.
References
- Scallan E, Hoekstra RM, Angulo FJ, Tauxe RV, Widdowson MA, Roy SL, et al. Foodborne illness acquired in the United States—major pathogens. Emerg Infect Dis. 2011;17:7–15. DOIPubMedGoogle Scholar
- US Department of Agriculture Economic Research Service. Food expenditures: table 10, food away from home as a share of food expenditures 2016 [cited 2018 Sep 17]. https://www.ers.usda.gov/data-products/food-expenditures.aspx
- Centers for Disease Control and Prevention. Surveillance for foodborne disease outbreaks, United States, 2014, Annual Report. Atlanta: US Department of Health and Human Services; 2016.
- Jones TF, Angulo FJ. Eating in restaurants: a risk factor for foodborne disease? Clin Infect Dis. 2006;43:1324–8. DOIPubMedGoogle Scholar
- Healthy People 2020. 2020 topics and objectives. 2018 Sep 21 [cited 2018 Sep 25]; https://www.healthypeople.gov/2020/topics-objectives
- Centers for Disease Control and Prevention. Foodborne Disease Active Surveillance Network (FoodNet): FoodNet 2015 surveillance report (final data). Atlanta: US Department of Health and Human Services; 2017.
- New York City Department of Health and Mental Hygiene. Notice of adoption of amendments to Article 81 of the New York City Health Code. 2010 [cited 2018 Sep 25]. https://www1.nyc.gov/assets/doh/downloads/pdf/notice/2010/Article-81.pdf
- Fung A, Graham M, Weil D. Full disclosure: the perils and promise of transparency. Cambridge: Cambridge University Press; 2007.
- Wong MR, McKelvey W, Ito K, Schiff C, Jacobson JB, Kass D. Impact of a letter-grade program on restaurant sanitary conditions and diner behavior in New York City. Am J Public Health. 2015;105:e81–7. DOIPubMedGoogle Scholar
- Jin GZ, Leslie P. The effect of information on product quality: evidence from restaurant hygiene grade cards. Q J Econ. 2003;118:409–51. DOIGoogle Scholar
- Simon PA, Leslie P, Run G, Jin GZ, Reporter R, Aguirre A, et al. Impact of restaurant hygiene grade cards on foodborne-disease hospitalizations in Los Angeles County. J Environ Health. 2005;67:32–6, 56, quiz 59–60.PubMedGoogle Scholar
- Centers for Disease Control and Prevention. 2018 National notifiable conditions. [cited 2018 July 14]. https://wwwn.cdc.gov/nndss/conditions/notifiable/2018/
- Wagner AK, Soumerai SB, Zhang F, Ross-Degnan D. Segmented regression analysis of interrupted time series studies in medication use research. J Clin Pharm Ther. 2002;27:299–309. DOIPubMedGoogle Scholar
- Johns M, Farley SM, Rajulu DT, Kansagra SM, Juster HR. Smoke-free parks and beaches: an interrupted time-series study of behavioural impact in New York City. Tob Control. 2015;24:497–500. DOIPubMedGoogle Scholar
- New York City Department of Health and Mental Hygiene. Notice of adoption of an amendment to Title 24 of the rules of the City of New York adding Chapter 23 (“Food Service Establishment Inspection Procedures”). New York: The Department; 2005.
- Patrick ME, Adcock PM, Gomez TM, Altekruse SF, Holland BH, Tauxe RV, et al. Salmonella enteritidis infections, United States, 1985-1999. Emerg Infect Dis. 2004;10:1–7. DOIPubMedGoogle Scholar
- Nguyen TQ, Thorpe L, Makki HA, Mostashari F. Benefits and barriers to electronic laboratory results reporting for notifiable diseases: the New York City Department of Health and Mental Hygiene experience. Am J Public Health. 2007;97(Suppl 1):S142–5. DOIPubMedGoogle Scholar
- Centers for Disease Control and Prevention. FoodCORE Center: New York City. 2016 [cited 2018 March 26]. https://www.cdc.gov/foodcore/centers/nyc.html
- McKenzie B, Koerber W, Fields A, Benetsky M, Rapino M. Commuter-adjusted population estimates: ACS 2006–10. 2013 [cited 2018 Sep 17]. https://census.gov/library/working-papers/2013/acs/2013_McKenzie_02.html
- NYC and Company. NYC travel and tourism visitation statistics [cited 2018 Feb 22]. http://www.nycandcompany.org/research/nyc-statistics-page
- New York City Department of Health and Mental Hygiene. Restaurant grading in New York City at 18 months. New York: The Department; 2012.
- Silva J, Leite D, Fernandes M, Mena C, Gibbs PA, Teixeira P. Campylobacter spp. as a foodborne pathogen: a review. Front Microbiol. 2011;2:200. DOIPubMedGoogle Scholar
- Lee P, Hedberg CW. Understanding the relationships between inspection results and risk of foodborne illness in restaurants. Foodborne Pathog Dis. 2016;13:582–6. DOIPubMedGoogle Scholar
- Angelo KM, Nisler AL, Hall AJ, Brown LG, Gould LH. Epidemiology of restaurant-associated foodborne disease outbreaks, United States, 1998-2013. Epidemiol Infect. 2017;145:523–34. DOIPubMedGoogle Scholar
Figure
Tables
Cite This ArticleOriginal Publication Date: November 13, 2018
Table of Contents – Volume 24, Number 12—December 2018
| EID Search Options |
|---|
|
|
|
|
|
|
Please use the form below to submit correspondence to the authors or contact them at the following address:
Melanie J. Firestone, University of Minnesota School of Public Health, 420 Delaware St SE, Mayo Mail Code 807, Minneapolis, MN 55455, USA
Top