Volume 24, Number 3—March 2018
Research
Genetic Spatiotemporal Anatomy of Plasmodium vivax Malaria Episodes in Greece, 2009–2013
Gregory Spanakos, Georges Snounou, Danai Pervanidou, Michael Alifrangis, Anna Rosanas-Urgell, Agoritsa Baka, Maria Tseroni, Annita Vakali, Evdokia Vassalou, Eleni Patsoula, Herve Zeller, Wim Van Bortel, Christos Hadjichristodoulou , and for the MALWEST Project
Figure 2
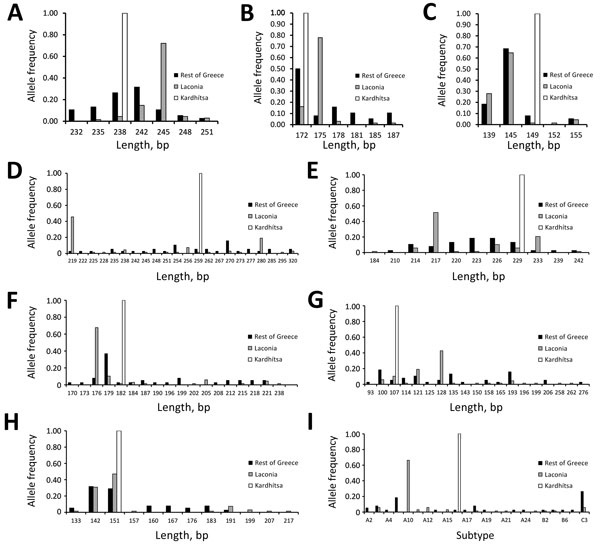
Figure 2. Frequency distribution of Plasmodium vivax allelic variants and lengths or subtype of genetic markers, by geographic location, Greece, 2009–2013. The frequencies for microsatellite markers MS1 (A), MS5 (B), MS7 (C), MS8 (D), MS12 (E), MS20 (F), m1501 (G), and m3502 (H) and gene fragment msp3 (I) are calculated separately for the samples from each of the 3 geographic sets: Laconia (n = 68), Kardhítsa (n = 12), and the rest of Greece (n = 38).
1Additional members of MALWEST Project are listed at the end of this article.
Page created: February 15, 2018
Page updated: February 15, 2018
Page reviewed: February 15, 2018
The conclusions, findings, and opinions expressed by authors contributing to this journal do not necessarily reflect the official position of the U.S. Department of Health and Human Services, the Public Health Service, the Centers for Disease Control and Prevention, or the authors' affiliated institutions. Use of trade names is for identification only and does not imply endorsement by any of the groups named above.