Volume 24, Number 3—March 2018
Dispatch
Statistical Method to Detect Tuberculosis Outbreaks among Endemic Clusters in a Low-Incidence Setting
Sandy P. Althomsons , Andrew N. Hill, Alexia V. Harrist, Anne Marie France, Krista M. Powell, James E. Posey, Lauren S. Cowan, and Thomas R. Navin
Figure 1
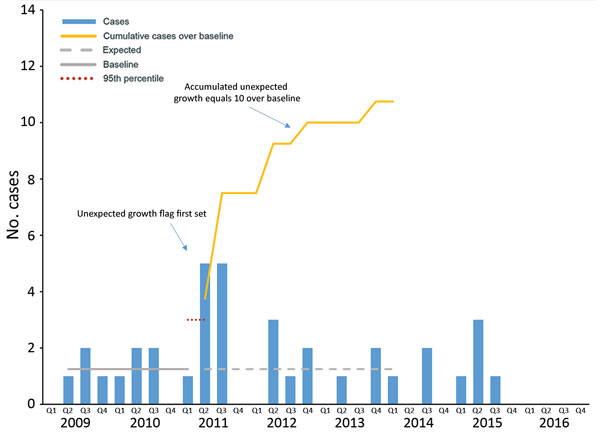
Figure 1. Epidemiologic curve showing a prevalent (endemic) outbreak of tuberculosis, by case counts per 3-month period, United States, 2009–2016. Q, quarter.
Page created: February 16, 2018
Page updated: February 16, 2018
Page reviewed: February 16, 2018
The conclusions, findings, and opinions expressed by authors contributing to this journal do not necessarily reflect the official position of the U.S. Department of Health and Human Services, the Public Health Service, the Centers for Disease Control and Prevention, or the authors' affiliated institutions. Use of trade names is for identification only and does not imply endorsement by any of the groups named above.