Skip directly to site content Skip directly to page options Skip directly to A-Z link Skip directly to A-Z link Skip directly to A-Z link
Volume 24, Number 6—June 2018
Dispatch

Novel Salmonella enterica Serovar Typhimurium Genotype Levels as Herald of Seasonal Salmonellosis Epidemics

Cristina Sotomayor, Qinning Wang, Alicia Arnott, Peter Howard, Kirsty Hope, Ruiting Lan, and Vitali SintchenkoComments to Author 
Author affiliations: Universidad Austral de Chile, Valdivia, Chile (C. Sotomayor); Centre for Infectious Diseases and Microbiology Public Health, Westmead, New South Wales, Australia (C. Sotomayor, Q. Wang, A. Arnott, P. Howard, V. Sintchenko); University of Sydney, Sydney, New South Wales, Australia (C. Sotomayor, A. Arnott, V. Sintchenko); New South Wales Ministry of Health, Sydney (K. Hope); University of New South Wales, Sydney (R. Lan)

Main Article

Figure 2

Population dynamics of Salmonella enterica serovar Typhimurium MLVA types, New South Wales, Australia, 2009–2016. A) Total number of novel or unique MLVA types. Red bars indicate high season and gray bars low season. B) Temporal dynamics of the most common MLVA types expressed as proportions by type. C) Quarterly counts of novel MLVA types during winter, spring, and summer for high and low seasons (p = 0.05). D) Box plots of the mean ratio of novel MLVA type counts during high and low seasons (p

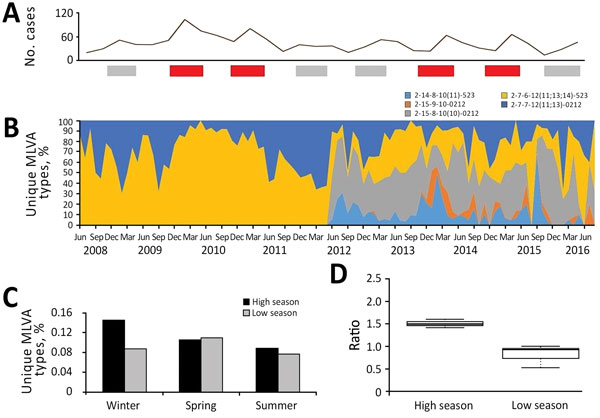
Figure 2. Population dynamics of Salmonella enterica serovar Typhimurium MLVA types, New South Wales, Australia, 2009–2016. A) Total number of novel or unique MLVA types. Red bars indicate high season and gray bars low season. B) Temporal dynamics of the most common MLVA types expressed as proportions by type. C) Quarterly counts of novel MLVA types during winter, spring, and summer for high and low seasons (p = 0.05). D) Box plots of the mean ratio of novel MLVA type counts during high and low seasons (p = 0.006). Box top and bottom indicate third and first quartiles, respectively; horizontal lines within boxes indicate medians; whiskers indicate CIs; dotted vertical lines indicate the spread of values in the subgroup. We built box plots with BoxPlotR (http://shiny.chemgrig.org). MLVA, multilocus variable-number tandem-repeat analysis

Main Article

Page created: May 17, 2018
Page updated: May 17, 2018
Page reviewed: May 17, 2018
The conclusions, findings, and opinions expressed by authors contributing to this journal do not necessarily reflect the official position of the U.S. Department of Health and Human Services, the Public Health Service, the Centers for Disease Control and Prevention, or the authors' affiliated institutions. Use of trade names is for identification only and does not imply endorsement by any of the groups named above.
file_external