Volume 24, Number 7—July 2018
Research
Virus RNA Load in Patients with Tick-Borne Encephalitis, Slovenia
Ana Saksida, Nina Jakopin, Mateja Jelovšek, Nataša Knap, Luka Fajs, Lara Lusa, Stanka Lotrič-Furlan, Petra Bogovič, Maja Arnež, Franc Strle, and Tatjana Avšič-Županc
Figure 2
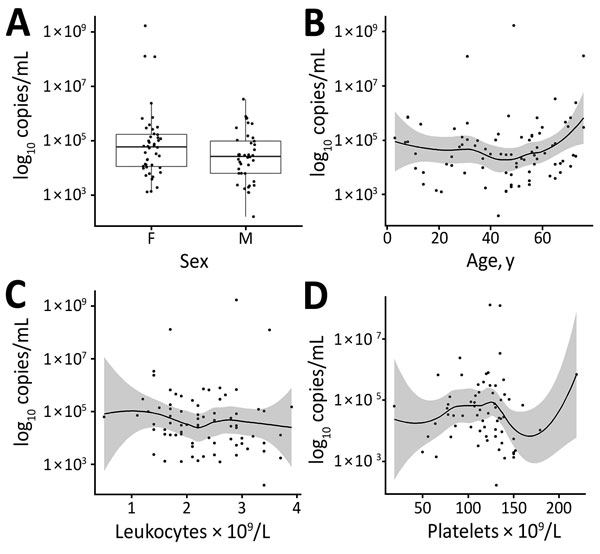
Figure 2. Distribution of virus RNA load in patients with tick-borne encephalitis, Slovenia, by patient sex (A), age (B), leukocyte count (C), and platelet count determined on the same day as RNA load (D). Boxes in panel A indicate interquartile ranges and 25th and 75th percentiles, horizontal lines within boxes indicate medians, and errors bars indicate 1.5× interquartile ranges. Solid lines in panels B–D indicate loess regression lines, and shaded areas indicate 95% CIs.
Page created: June 18, 2018
Page updated: June 18, 2018
Page reviewed: June 18, 2018
The conclusions, findings, and opinions expressed by authors contributing to this journal do not necessarily reflect the official position of the U.S. Department of Health and Human Services, the Public Health Service, the Centers for Disease Control and Prevention, or the authors' affiliated institutions. Use of trade names is for identification only and does not imply endorsement by any of the groups named above.