Volume 24, Number 8—August 2018
Dispatch
Variation in Influenza B Virus Epidemiology by Lineage, China
Figure 1

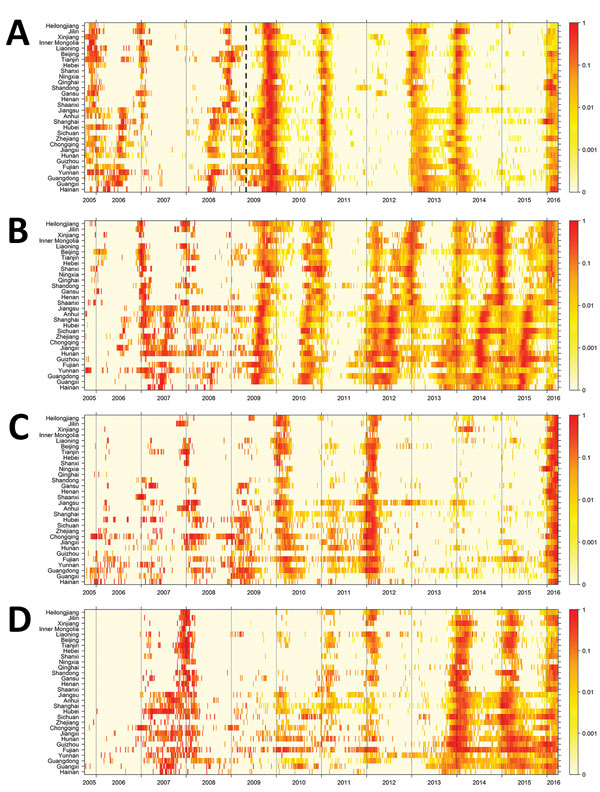
Figure 1. Heatmap of influenza virus activity by lineage in 30 provinces and municipalities (sorted by latitude), China, October 2005–March 2016. A) Influenza A(H1N1); B) influenza A(H3N2); C) influenza B Victoria lineage; D) influenza B Yamagata lineage. Map is based on 2,498,735 specimens collected from the sentinel hospitals. Normalized virus activity is shown for each province and municipality as the product of the weekly proportion of influenza-like illness consultations and the weekly proportion of sentinel specimens testing positive for influenza viruses divided by the maximum virus activity in the province or municipality throughout the study period to give a rescaled proxy with values between 0 (no activity) and 1 (highest activity in that province). The dashed line in panel for A indicates the start of the H1N1 pandemic in 2009.
1These authors contributed equally to this article.
2Current affiliation: Fudan University School of Public Health, Key Laboratory of Public Health Safety, Ministry of Education, Shanghai, China.