Volume 25, Number 10—October 2019
Research
Early Diagnosis of Tularemia by Flow Cytometry, Czech Republic, 2003–20151
Aleš Chrdle , Pavlína Tinavská, Olga Dvořáčková, Pavlína Filipová, Věra Hnetilová, Pavel Žampach, Květoslava Batistová, Václav Chmelík, Amanda E. Semper, and Nick J. Beeching
Figure 6
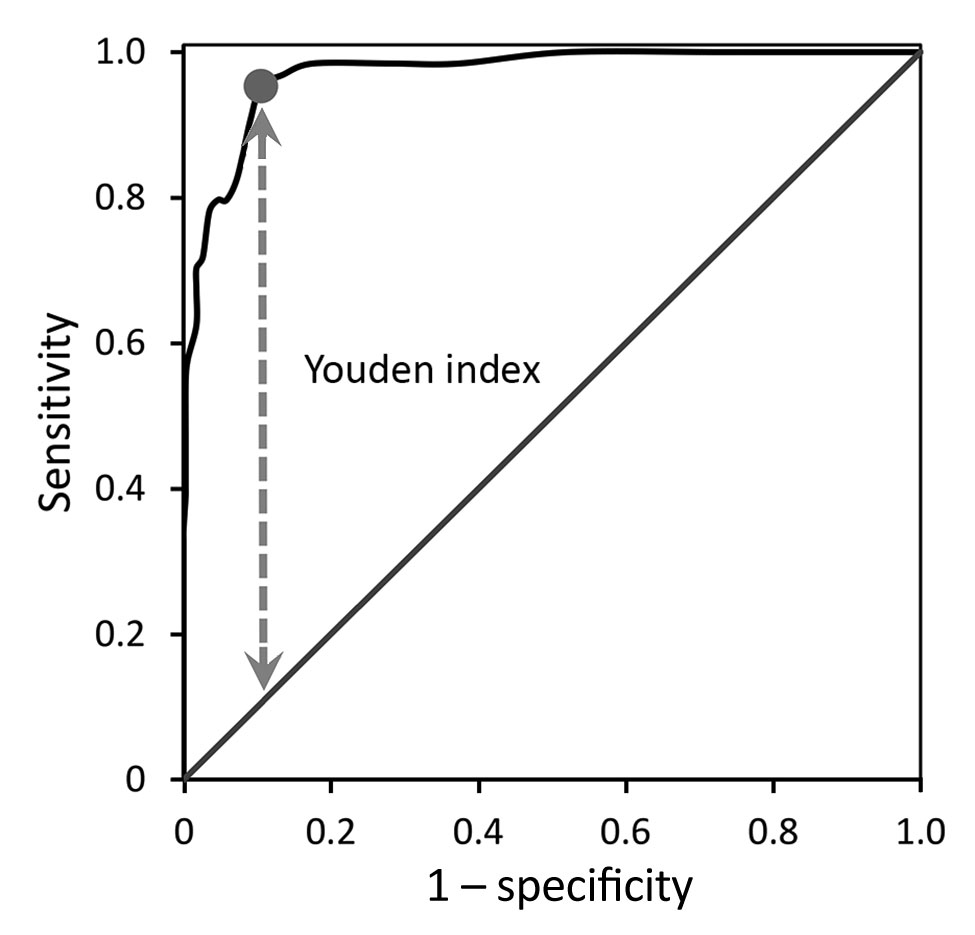
Figure 6. Receiver operating characteristic curve for diagnostic utility of raised CD3+/CD4–/CD8– T cells distinguishing probable and confirmed tularemia cases (n = 64, 2003–2015) from controls (n = 342, 2012–2015), Czech Republic. The area under the receiver operating characteristic curve is 0.970 (95% CI 0.952–0.988). The Youden index (circle on curve) is the maximal vertical distance (dashed line) of the curve from the diagonal line.
1Preliminary data from this study were presented at the European Congress of Clinical Microbiology and Infectious Diseases; April 9–12, 2016; Amsterdam, the Netherlands (abstract no. O367).
Page created: September 17, 2019
Page updated: September 17, 2019
Page reviewed: September 17, 2019
The conclusions, findings, and opinions expressed by authors contributing to this journal do not necessarily reflect the official position of the U.S. Department of Health and Human Services, the Public Health Service, the Centers for Disease Control and Prevention, or the authors' affiliated institutions. Use of trade names is for identification only and does not imply endorsement by any of the groups named above.