Volume 25, Number 12—December 2019
Dispatch
Predicting Dengue Outbreaks in Cambodia
Anthony Cousien, Julia Ledien, Kimsan Souv, Rithea Leang, Rekol Huy, Didier Fontenille, Sowath Ly, Veasna Duong, Philippe Dussart, Patrice Piola1 , Simon Cauchemez1, and Arnaud Tarantola1
Figure 2
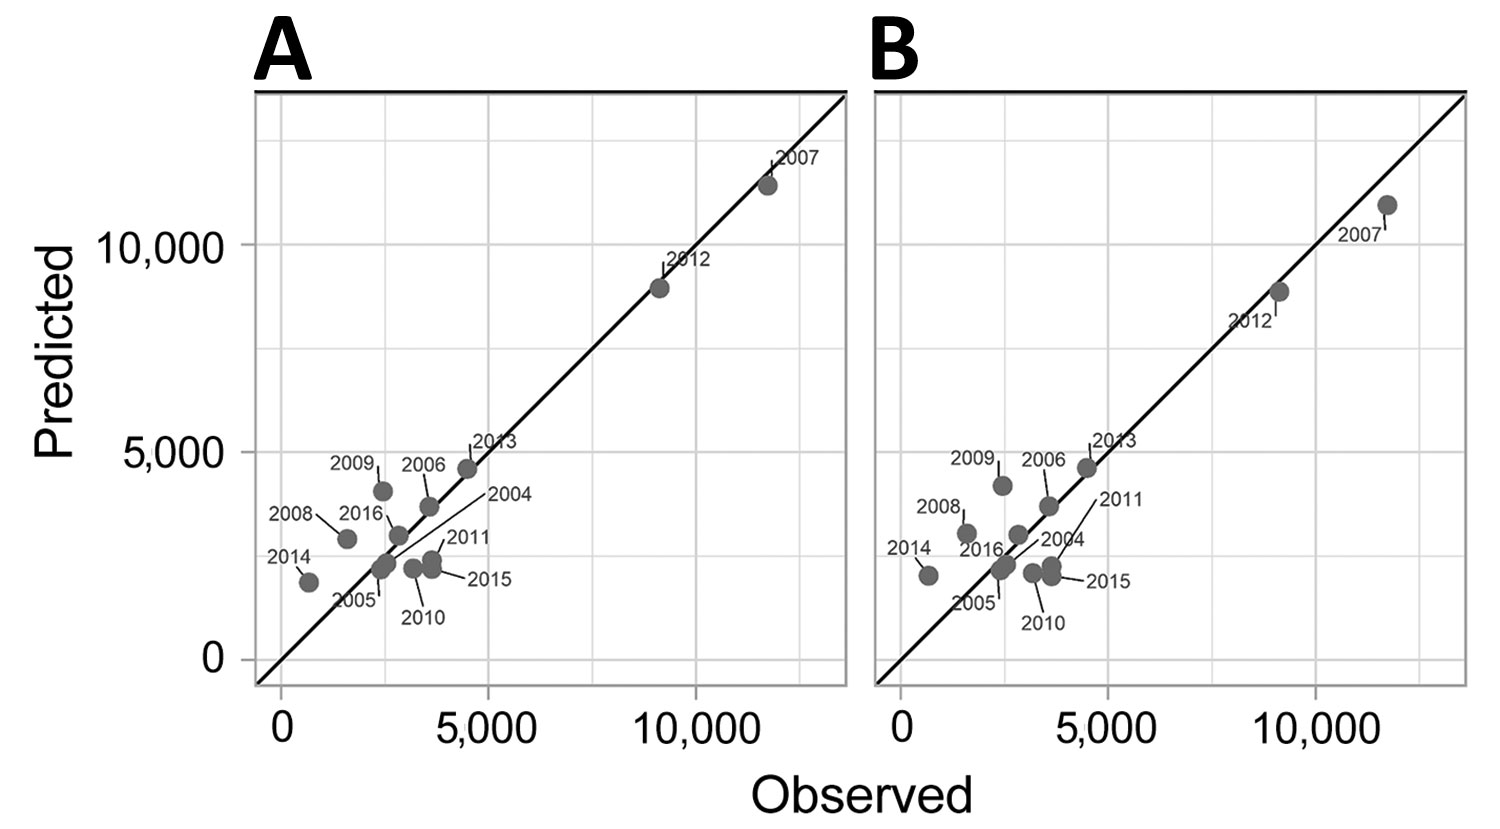
Figure 2. Dengue cases in Cambodia, 2004–2016. A) Observed versus predicted magnitude of the peak for each dengue season. We used a simple linear regression model, M = α + βN, in which M indicates the magnitude of the peak and N the number of reported dengue-like cases in April. The black line represents the expected results with perfect prediction. B) Results for the leave-one-out cross-validation procedure.
1These senior authors contributed equally to this article.
Page created: November 18, 2019
Page updated: November 18, 2019
Page reviewed: November 18, 2019
The conclusions, findings, and opinions expressed by authors contributing to this journal do not necessarily reflect the official position of the U.S. Department of Health and Human Services, the Public Health Service, the Centers for Disease Control and Prevention, or the authors' affiliated institutions. Use of trade names is for identification only and does not imply endorsement by any of the groups named above.