Nipah Virus Sequences from Humans and Bats during Nipah Outbreak, Kerala, India, 2018
Pragya D. Yadav, Anita M. Shete, G. Arun Kumar, Prasad Sarkale, Rima R. Sahay, Chandni Radhakrishnan, Rajen Lakra, Prachi Pardeshi, Nivedita Gupta, Raman R. Gangakhedkar, V.R. Rajendran, Rajeev Sadanandan, and Devendra T. Mourya

Author affiliations: Indian Council of Medical Research–National Institute of Virology, Pune, India (P.D. Yadav, A.M. Shete, P. Sarkale, R.R. Sahay, R. Lakra, P. Pardeshi, D.T. Mourya); Manipal Centre for Virus Research, Manipal, India (G.A. Kumar); Government Medical College Kozhikode, Kozhikode, India (C. Radhakrishnan, V.R. Rajendran); Indian Council of Medical Research, New Delhi, India (N. Gupta, R.R. Gangakhedkar); Health & Family Welfare, Kerala (R. Sadanandan)
Main Article
Figure 2
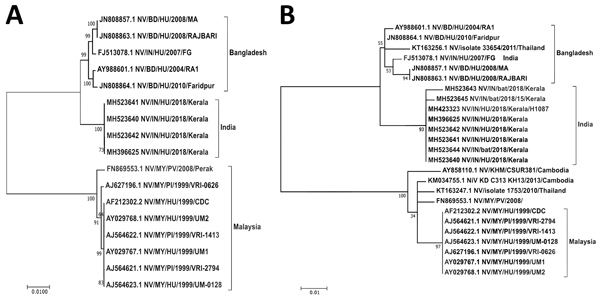
Figure 2. Maximum-likelihood phylogenetic tree of the nucleocapsid gene (region 1293–1608) of Nipah virus from Kerala, India, 2018, and reference sequences. A) Complete coding region. The evolution distance for 17 complete sequences was generated using the Tamura-Nei model plus gamma distance using different isolates. Bootstrap replication of 500 replications cycle was used for the statistical assessment of the generated tree. B) Partial nucleocapsid gene. The evolution distance for 25 nucleocapsid gene sequences of length 316 nt was generated using the Tamura-Nei model plus gamma distance using different isolates. Bootstrap replication of 500-replication cycle was used for the statistical assessment of the generated tree. GenBank accession numbers are provided for all sequences. Scale bars indicate nucleotide substitutions per site.
Main Article
Page created: April 18, 2019
Page updated: April 18, 2019
Page reviewed: April 18, 2019
The conclusions, findings, and opinions expressed by authors contributing to this journal do not necessarily reflect the official position of the U.S. Department of Health and Human Services, the Public Health Service, the Centers for Disease Control and Prevention, or the authors' affiliated institutions. Use of trade names is for identification only and does not imply endorsement by any of the groups named above.