Volume 25, Number 6—June 2019
Research
Enhancement of Risk for Lyme Disease by Landscape Connectivity, New York, New York, USA
Meredith C. VanAcker , Eliza A.H. Little, Goudarz Molaei, Waheed I. Bajwa, and Maria A. Diuk-Wasser
Figure 2
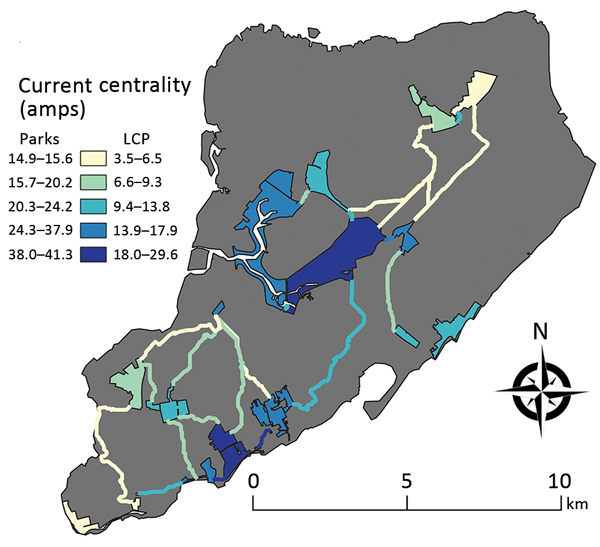
Figure 2. Current centrality for parks and linkages on Staten Island, New York, USA, 2017. In connectivity analysis, the park outlines were used as nodes, and gray indicates the matrix used for the resistance layer. The parks and linkages are color-graded according to their centrality values. Lighter colors indicate lower centrality, and darker colors indicate higher centrality for the network. Amps is the unit used to describe the flow of charge through the nodes. LCP, least cost path.
Page created: May 20, 2019
Page updated: May 20, 2019
Page reviewed: May 20, 2019
The conclusions, findings, and opinions expressed by authors contributing to this journal do not necessarily reflect the official position of the U.S. Department of Health and Human Services, the Public Health Service, the Centers for Disease Control and Prevention, or the authors' affiliated institutions. Use of trade names is for identification only and does not imply endorsement by any of the groups named above.