Skip directly to site content Skip directly to page options Skip directly to A-Z link Skip directly to A-Z link Skip directly to A-Z link
Volume 25, Number 7—July 2019
Research

Mitochondrial Junction Region as Genotyping Marker for Cyclospora cayetanensis

Fernanda S. Nascimento, John R. Barta, Julia Whale, Jessica N. Hofstetter, Shannon Casillas, Joel Barratt, Eldin Talundzic, Michael J. Arrowood, and Yvonne QvarnstromComments to Author 
Author affiliations: Centers for Disease Control and Prevention, Atlanta, Georgia, USA (F.S. Nascimento, J.N. Hofstetter, S. Casillas, J. Barratt, E. Talundzic, M.J. Arrowood, Y. Qvarnstrom); University of Guelph, Guelph, Ontario, Canada (J.R. Barta, J. Whale)

Main Article

Figure

Relationships between detected Cyclospora mitochondrial junction (Cmt) types, United States. Fourteen unique Cmt types were detected. Cmt214.A (top left) was not detected in this study but was reported previously (GenBank accession no. MH430089.1); it represents the type with the largest number of 15-mer repeats (total 6) and is therefore included as reference for comparison. Three different 15-mer repeat sequences are known, and each Cmt type possesses 2–6 of these 15-mer repeats in various com

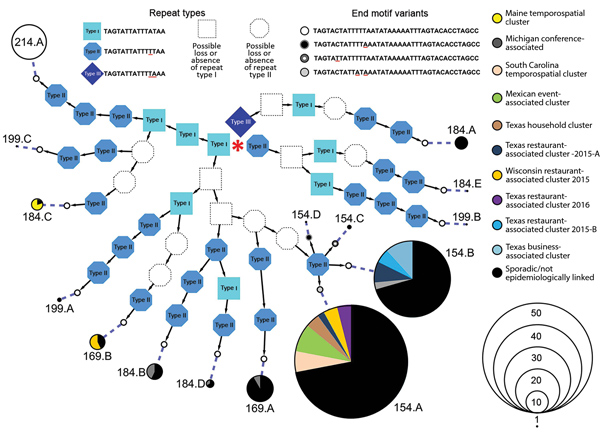
Figure. Relationships between detected Cyclospora mitochondrial junction (Cmt) types, United States. Fourteen unique Cmt types were detected. Cmt214.A (top left) was not detected in this study but was reported previously (GenBank accession no. MH430089.1); it represents the type with the largest number of 15-mer repeats (total 6) and is therefore included as reference for comparison. Three different 15-mer repeat sequences are known, and each Cmt type possesses 2–6 of these 15-mer repeats in various combinations. The sequence of each mt junction type can be elucidated from this figure starting with the first repeat, indicated by the red central asterisk, and then following the arrows to the end motif. A dashed line links the sequence to a pie chart that provides epidemiologic information. The size of the pie chart represents the number of times this particular Cmt type was detected. For instance, type 154.A was detected in 50 samples (as reflected by the scale) and represents the most common type. Red underlined letters indicate variable sites that exist in the end motif and 15-mer repeats.

Main Article

Page created: June 17, 2019
Page updated: June 17, 2019
Page reviewed: June 17, 2019
The conclusions, findings, and opinions expressed by authors contributing to this journal do not necessarily reflect the official position of the U.S. Department of Health and Human Services, the Public Health Service, the Centers for Disease Control and Prevention, or the authors' affiliated institutions. Use of trade names is for identification only and does not imply endorsement by any of the groups named above.
file_external