Volume 26, Number 3—March 2020
Dispatch
Avian Influenza Virus Detection Rates in Poultry and Environment at Live Poultry Markets, Guangdong, China
Kit Ling Cheng1, Jie Wu1, Wei Ling Shen, Alvina Y.L. Wong, Qianfang Guo, Jianxiang Yu, Xue Zhuang, Wen Su, Tie Song, Malik Peiris, Hui-Ling Yen2 , and Eric H.Y. Lau2
Figure 2
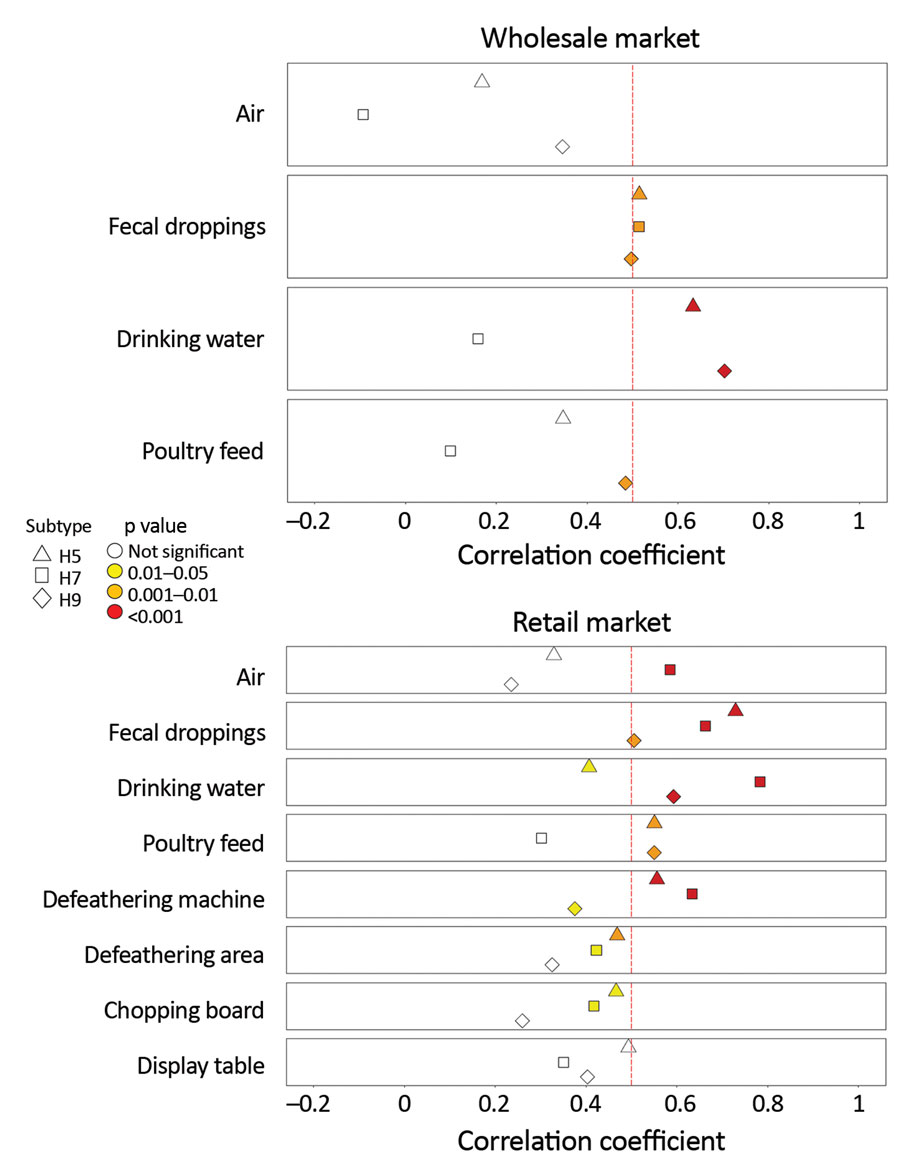
Figure 2. Correlation between AIV detection rates in poultry and environmental samples at live poultry markets (LPMs), Guangdong, China, December 2015–July 2018. Monthly AIV, H5, H7, and H9 detection rates in chicken and environmental samples were analyzed using Spearman’s rank correlation. The vertical red dashed line indicates correlation coefficient (rs) at 0.5. Subtypes and significance levels are indicated. AIV, avian influenza virus.
1These authors contributed equally to this article.
2These senior authors contributed equally to this article.
Page created: February 20, 2020
Page updated: February 20, 2020
Page reviewed: February 20, 2020
The conclusions, findings, and opinions expressed by authors contributing to this journal do not necessarily reflect the official position of the U.S. Department of Health and Human Services, the Public Health Service, the Centers for Disease Control and Prevention, or the authors' affiliated institutions. Use of trade names is for identification only and does not imply endorsement by any of the groups named above.