Volume 26, Number 3—March 2020
Dispatch
Avian Influenza Virus Detection Rates in Poultry and Environment at Live Poultry Markets, Guangdong, China
Kit Ling Cheng1, Jie Wu1, Wei Ling Shen, Alvina Y.L. Wong, Qianfang Guo, Jianxiang Yu, Xue Zhuang, Wen Su, Tie Song, Malik Peiris, Hui-Ling Yen2 , and Eric H.Y. Lau2
Figure 1
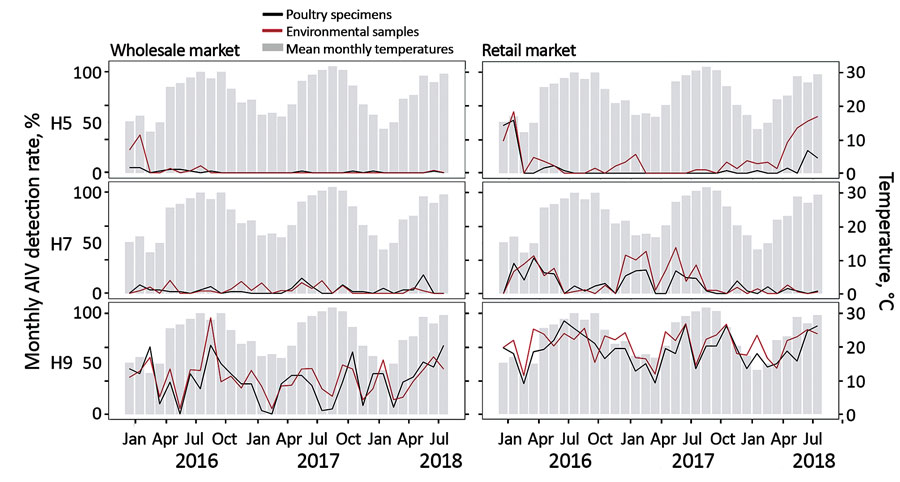
Figure 1. Monthly AIV H5, H7, and H9 positivity rates detected in poultry and environmental samples at live poultry markets (LPMs), Guangdong, China, December 2015–July 2018. Chicken (oropharyngeal and cloacal swab specimens) and environmental (swab specimens and air samples) samples were collected monthly from 1 retail and 1 wholesale LPM in Guangzhou and tested for H5, H7, and H9 AIV by real-time RT-PCR. Gray bars indicate mean temperatures recorded on the sampling date in Guangzhou. AIV, avian influenza virus.
1These authors contributed equally to this article.
2These senior authors contributed equally to this article.
Page created: February 20, 2020
Page updated: February 20, 2020
Page reviewed: February 20, 2020
The conclusions, findings, and opinions expressed by authors contributing to this journal do not necessarily reflect the official position of the U.S. Department of Health and Human Services, the Public Health Service, the Centers for Disease Control and Prevention, or the authors' affiliated institutions. Use of trade names is for identification only and does not imply endorsement by any of the groups named above.