Volume 26, Number 4—April 2020
Synopsis
Severe Dengue Epidemic, Sri Lanka, 2017
Hasitha A. Tissera , Bernard D.W. Jayamanne, Rajendra Raut, Sakunthala M.D. Janaki, Yesim Tozan, Preshila C. Samaraweera, Prasad Liyanage, Azhar Ghouse, Chaturaka Rodrigo, Aravinda M. de Silva, and Sumadhya D. Fernando
Figure 5
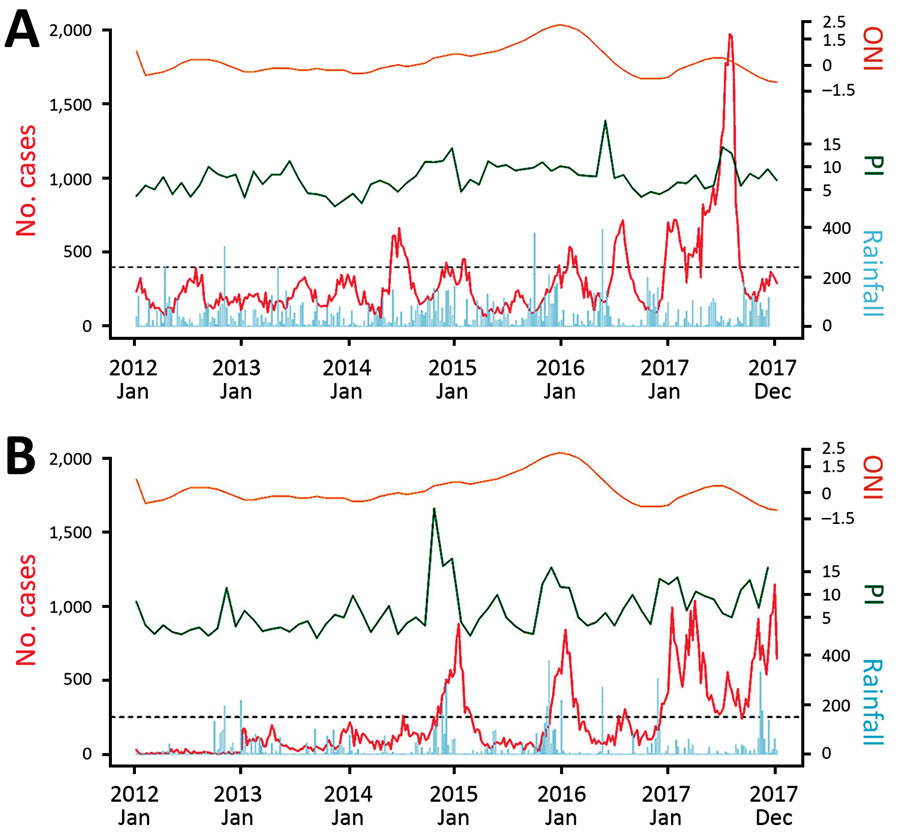
Figure 5. Time series plot showing weekly number of reported dengue cases (red line), ONI (orange line), PI (green line), and weekly cumulative rainfall, mm (blue line), Sri Lanka, 2012–2017. A) Colombo district. B) Jaffna district. ONI, Oceanic Niño Index; PI, Premise Index.
Page created: March 17, 2020
Page updated: March 17, 2020
Page reviewed: March 17, 2020
The conclusions, findings, and opinions expressed by authors contributing to this journal do not necessarily reflect the official position of the U.S. Department of Health and Human Services, the Public Health Service, the Centers for Disease Control and Prevention, or the authors' affiliated institutions. Use of trade names is for identification only and does not imply endorsement by any of the groups named above.