Volume 26, Number 4—April 2020
Synopsis
Severe Fever with Thrombocytopenia Syndrome, Japan, 2013–2017
Figure 2
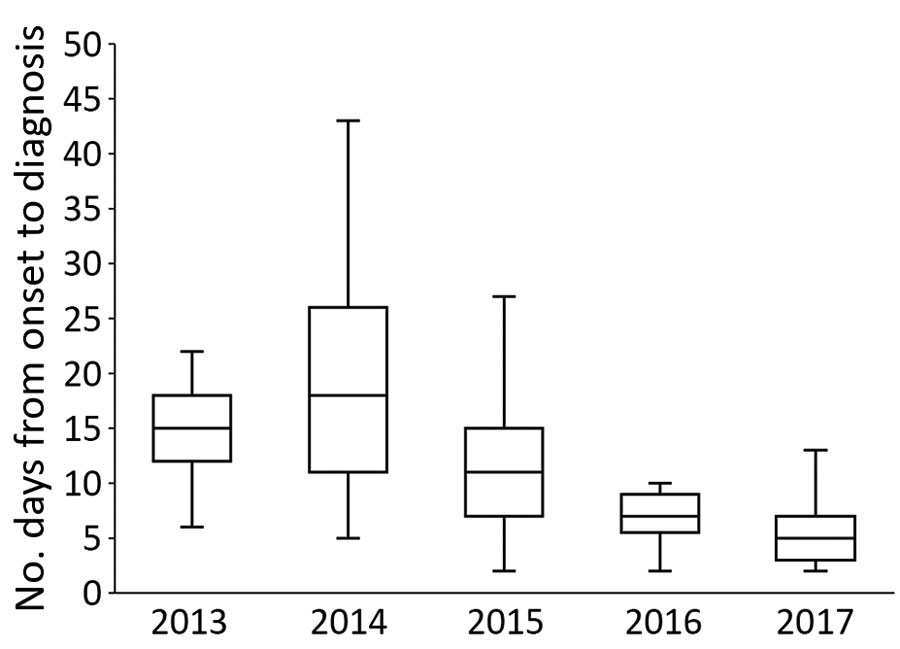
Figure 2. Comparison of time between illness onset and confirmed diagnosis in 133 patients with severe fever with thrombocytopenia syndrome, Japan, March 2013–October 2017. We conducted a trend analysis of time from initial visit to diagnosis over the study period by using the Jonkheere–Trapstra test (p<0.01). In the box plots, the bottom boundary of the box indicates the 25th percentile, the line within the box marks the median, and the top boundary of the box indicates the 75th percentile. Whiskers above and below the box indicate the 10th and 90th percentiles.
1Current affiliation: Saitama Prefectural Government, Saitama, Japan.
2Current affiliation: Okayama University of Science, Ehime, Japan.
3Current affiliation: Toyama Institute of Health, Toyama, Japan.
4Group members are listed at the end of the article.