Volume 26, Number 5—May 2020
Synopsis
Surveillance of Leprosy in Kiribati, 1935–2017
Stephen T. Chambers , Nabura Ioteba, Eretii Timeon, Erei Rimon, Helen Murdoch, Jared Green, Emma Trowbridge, Jane Buckingham, Arturo Cunanan, Jonathan Williman, and Patricia Priest
Figure 2
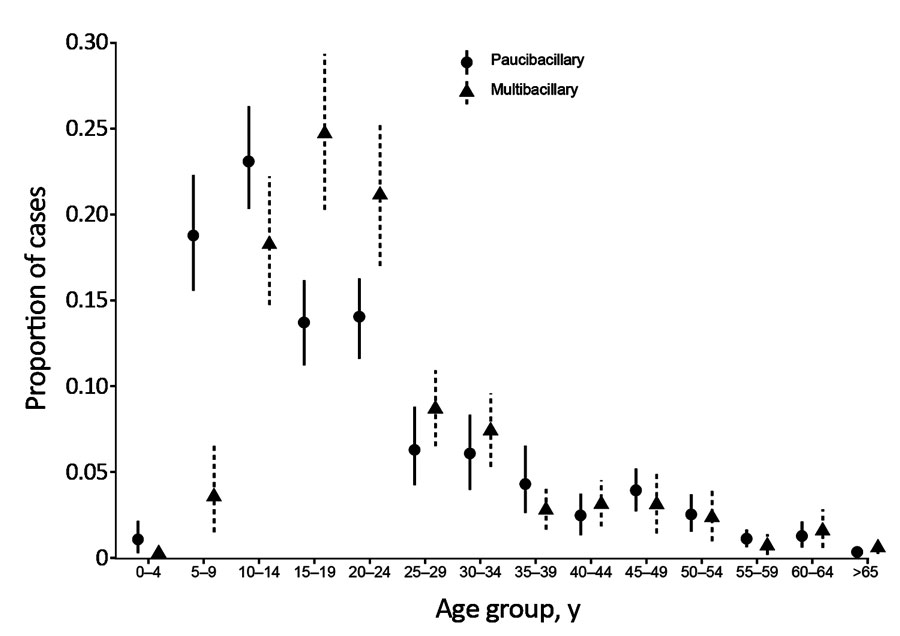
Figure 2. Distribution of cases of leprosy, by age group and type, Kiribati, 1988–2018. Points represent the pooled mean proportion of cases by age. Vertical lines represent bootstrapped 95% CIs.
Page created: April 16, 2020
Page updated: April 16, 2020
Page reviewed: April 16, 2020
The conclusions, findings, and opinions expressed by authors contributing to this journal do not necessarily reflect the official position of the U.S. Department of Health and Human Services, the Public Health Service, the Centers for Disease Control and Prevention, or the authors' affiliated institutions. Use of trade names is for identification only and does not imply endorsement by any of the groups named above.