Volume 26, Number 6—June 2020
Research
Temporary Fertility Decline after Large Rubella Outbreak, Japan
Kenji Mizumoto and Gerardo Chowell
Figure 4
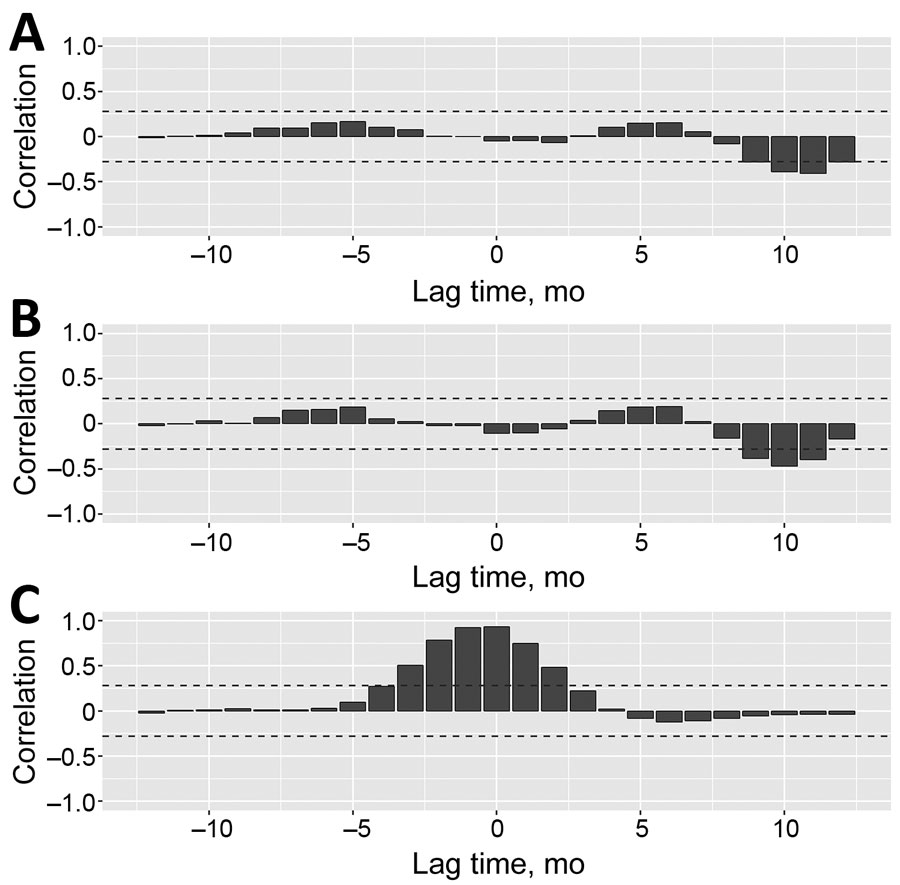
Figure 4. Temporal distribution of rubella cases, Google searches for the term “rubella,” and elevated fertility rates by prefecture, 2013–2017, Japan. A) Tokyo; B) Kanagawa; C) Osaka; D) Hyogo Time-series of rubella cases, Google searches for the term “rubella,” and seasonally- and trend-adjusted elevated fertility rates. The data are scaled between –1 and 1. Dark gray areas show the peak timing of rubella cases and the corresponding drop timing of fertility rates. Google search data collected from Google Trends (https://trends.google.com)..
Page created: May 18, 2020
Page updated: May 18, 2020
Page reviewed: May 18, 2020
The conclusions, findings, and opinions expressed by authors contributing to this journal do not necessarily reflect the official position of the U.S. Department of Health and Human Services, the Public Health Service, the Centers for Disease Control and Prevention, or the authors' affiliated institutions. Use of trade names is for identification only and does not imply endorsement by any of the groups named above.