Volume 26, Number 6—June 2020
Synopsis
Epidemiologic Changes of Scrub Typhus in China, 1952–2016
Zhongjie Li1, Hualei Xin1, Junling Sun1, Shengjie Lai, Lingjia Zeng, Canjun Zheng, Sarah E. Ray, Nicole Davis Weaver, Liping Wang, Jianxing Yu , Zijian Feng2, Simon I. Hay, and George F. Gao2
Figure 2
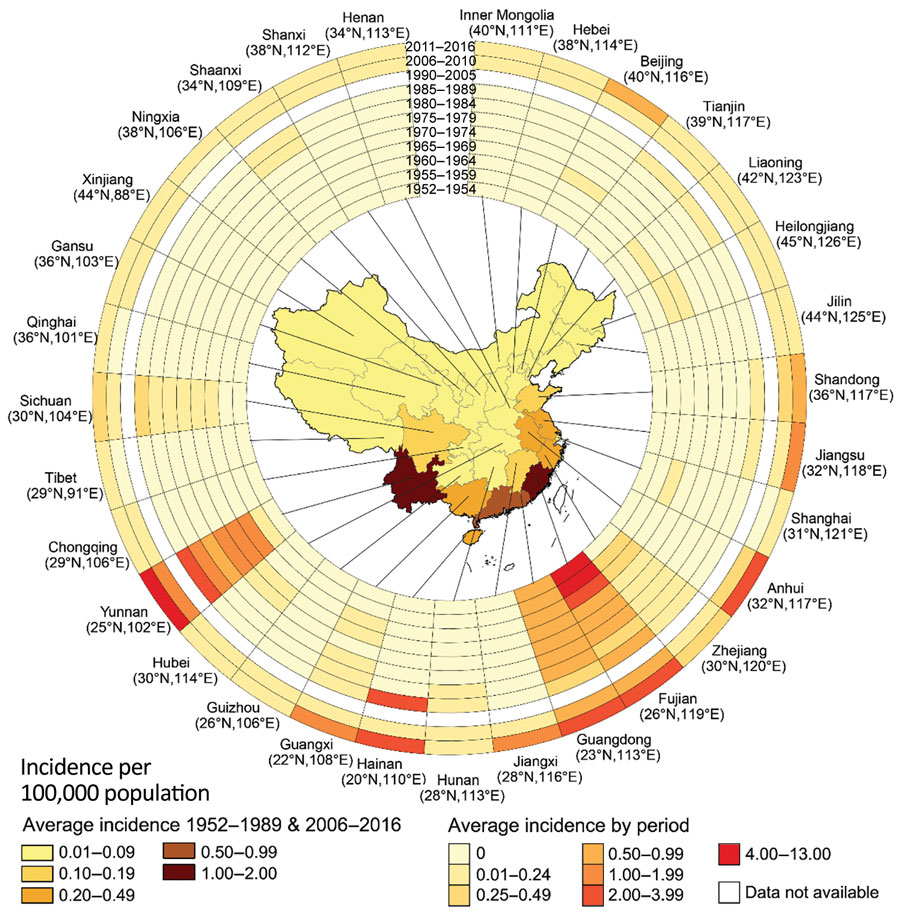
Figure 2. Incidence rate of scrub typhus for each province of China during 1952–1989 and 2006–2016, by time period. Annual average incidence of scrub typhus per 100,000 population in the 31 provinces investigated is shown. The rings contain data for 11 periods studied; the innermost ring shows data for early periods of 1952–1954, and the outermost ring data for 2011–2016. The latitude and longitude of the capital city of each province are shown.
1These first authors contributed equally to this article.
2These senior authors contributed equally to this article.
Page created: May 18, 2020
Page updated: May 18, 2020
Page reviewed: May 18, 2020
The conclusions, findings, and opinions expressed by authors contributing to this journal do not necessarily reflect the official position of the U.S. Department of Health and Human Services, the Public Health Service, the Centers for Disease Control and Prevention, or the authors' affiliated institutions. Use of trade names is for identification only and does not imply endorsement by any of the groups named above.