Volume 26, Number 6—June 2020
Synopsis
Epidemiologic Changes of Scrub Typhus in China, 1952–2016
Figure 5
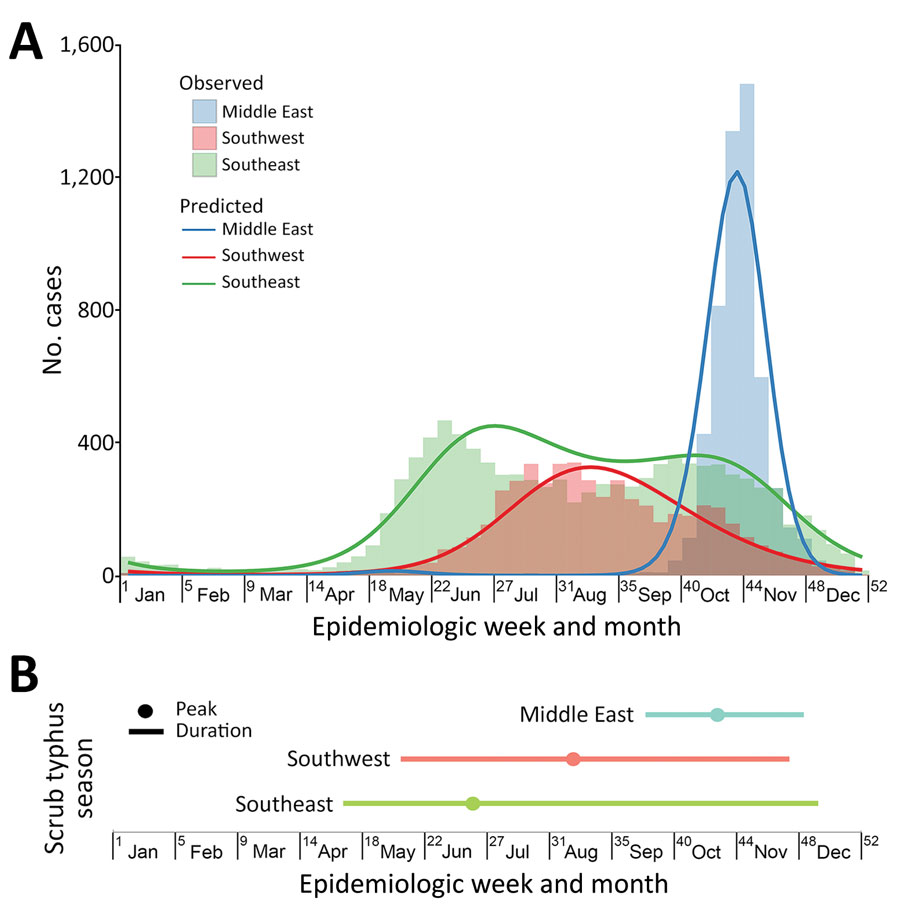
Figure 5. Seasonal characteristics of scrub typhus in China, 2006–2016. A) The weekly number of scrub typhus in year 2016, with a fitted seasonal curve superimposed, by epidemiologic regions identified. B) Duration and peak of scrub typhus seasons in epidemiologic regions. Scrub typhus season was defined as starting with the week in which a fast increase of average weekly case numbers began and ending with the week that the cumulative case numbers captured in the interval between the start and end accounted for >95% of the reported cases in 2006–2016. The colored dot in each region indicates the week with the highest predicted number of scrub typhus cases in the fitted seasonal curve (the peak). The colored bar indicates the number of weeks between season start and end (duration).
1These first authors contributed equally to this article.
2These senior authors contributed equally to this article.