Volume 26, Number 7—July 2020
Research
Identifying Locations with Possible Undetected Imported Severe Acute Respiratory Syndrome Coronavirus 2 Cases by Using Importation Predictions
Figure 1
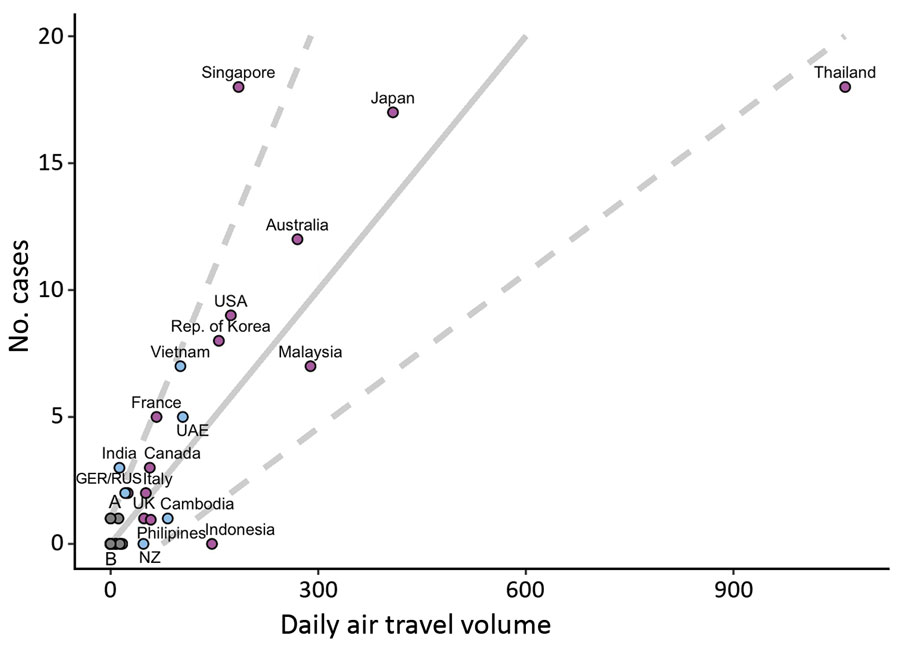
Figure 1. Plot showing imported-and-reported cases of severe acute respiratory syndrome coronavirus 2 (SARS-CoV-2) against air travel volume (no. persons/day) from Wuhan, China. No. cases refers to possible imported-and-reported SARS-CoV-2 cases. Solid line indicates the expected imported-and-reported case counts for locations based on the model fit to high surveillance locations (slope = 3.3 cases/100 passengers; p<0.001) . Dashed lines represent for the same model the smoothed 95% prediction interval bounds. Purple dots indicate locations with high surveillance capacity according to category 2 of the Global Health Security Index. Cluster A is composed of Nepal, Sri Lanka, Finland, and Sweden, locations with 1 imported-and-reported case and air travel volume of <20 passengers per day. Cluster B is composed of 161 locations with no imported-and-reported cases and estimated air travel <10 passengers per day. GER, Germany; NZ, New Zealand; RUS, Russia; UAE, United Arab Emirates; UK, United Kingdom; USA, United States of America.
1These authors contributed equally to this article.